

Actual patterns

Patterns are graphical models which are formed in the chart by the price. According to one of the technical analysis postulates, history (price movement) repeats itself. It means that the price movements are often similar in the same situations which makes it possible to predict the further development of the situation with a high probability.
Relevant patterns by InstaTrade is an easy-to-use service which allows you to be aware of latest changes in the market and react to clues from the market in time. In our service you will always find the latest and most relevant patterns on any pair and any timeframe.
Head and Shoulders
was formed on 07.04 at 15:29:59 (UTC+0)
signal strength 1 of 5

The USDCAD M5 formed the Head and Shoulders pattern with the following features: The Head’s top is at 1.4295, the Neckline and the upward angle are at 1.4237/1.4245. The formation of this pattern can bring about changes in the current trend from bullish to bearish. In case the pattern triggers the expected changes, the price of USDCAD will go towards 1.4230.
The M5 and M15 time frames may have more false entry points.
- All
- All
- Bearish Rectangle
- Bearish Symmetrical Triangle
- Bearish Symmetrical Triangle
- Bullish Rectangle
- Double Top
- Double Top
- Triple Bottom
- Triple Bottom
- Triple Top
- Triple Top
- All
- All
- Buy
- Sale
- All
- 1
- 2
- 3
- 4
- 5
Teratas Triple
was formed on 12.05 at 12:55:23 (UTC+0)
signal strength 1 of 5
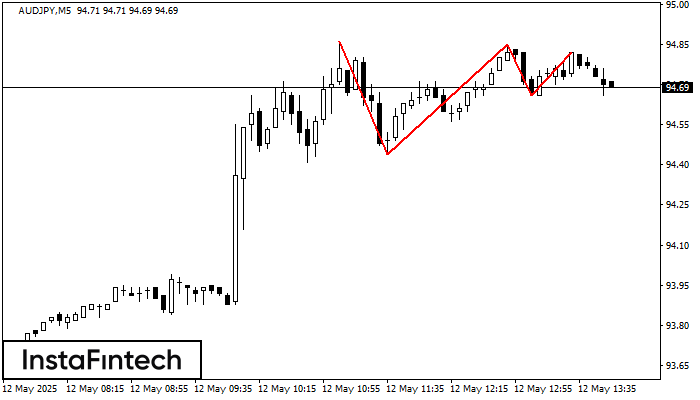
Pada grafik instrumen trading AUDJPY M5, pola Teratas Triple yang menandakan perubahan trend telah terbentuk. Ada kemungkinan bahwa setelah pembentukan puncak (peak) ketiga, harga akan mencoba untuk menembus level resistance
Rangka waktu M5 dan M15 mungkin memiliki lebih dari titik entri yang keliru.
Open chart in a new window
Teratas Ganda
was formed on 12.05 at 12:45:33 (UTC+0)
signal strength 1 of 5
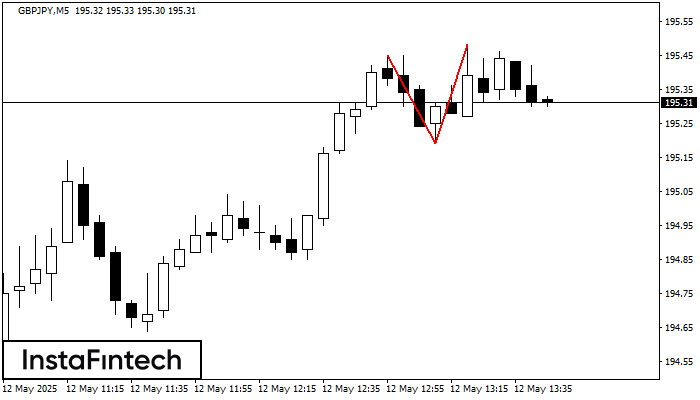
Pada grafik GBPJPY M5 pola reversal Teratas Ganda telah terbentuk. Karakteristik: batas atas 195.48; batas bawah 195.19; lebar pola 29 poin. Sinyal: tembusan ke batas bawah akan menyebabkan kelanjutan tren
Rangka waktu M5 dan M15 mungkin memiliki lebih dari titik entri yang keliru.
Open chart in a new window
Teratas Ganda
was formed on 12.05 at 12:10:20 (UTC+0)
signal strength 1 of 5
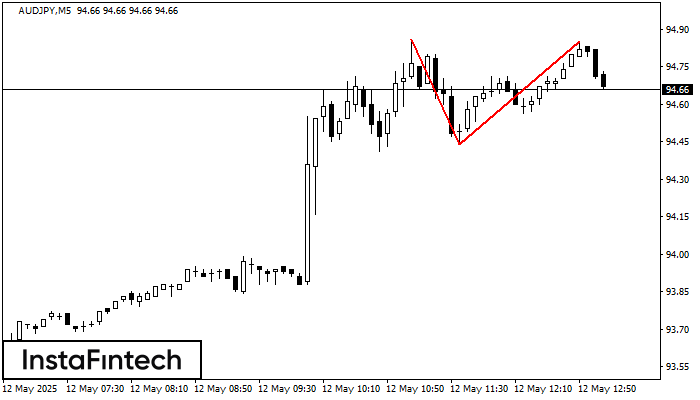
Pada grafik AUDJPY M5 pola reversal Teratas Ganda telah terbentuk. Karakteristik: batas atas 94.85; batas bawah 94.44; lebar pola 41 poin. Sinyal: tembusan ke batas bawah akan menyebabkan kelanjutan tren
Rangka waktu M5 dan M15 mungkin memiliki lebih dari titik entri yang keliru.
Open chart in a new window


