

Actual patterns

Patterns are graphical models which are formed in the chart by the price. According to one of the technical analysis postulates, history (price movement) repeats itself. It means that the price movements are often similar in the same situations which makes it possible to predict the further development of the situation with a high probability.
Relevant patterns by InstaTrade is an easy-to-use service which allows you to be aware of latest changes in the market and react to clues from the market in time. In our service you will always find the latest and most relevant patterns on any pair and any timeframe.
Double Bottom
was formed on 28.03 at 05:30:51 (UTC+0)
signal strength 1 of 5
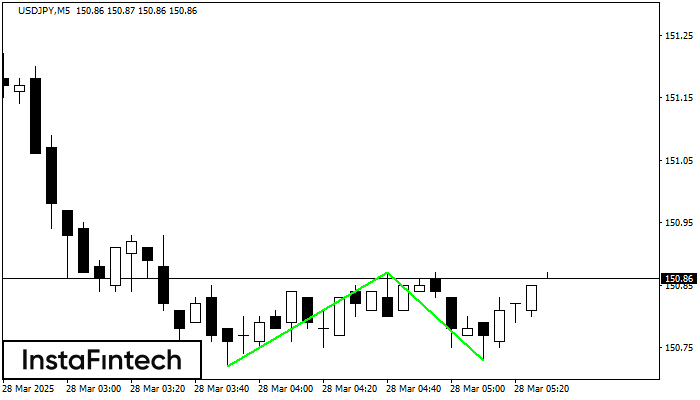
The Double Bottom pattern has been formed on USDJPY M5. Characteristics: the support level 150.72; the resistance level 150.87; the width of the pattern 15 points. If the resistance level is broken, a change in the trend can be predicted with the first target point lying at the distance of 14 points.
The M5 and M15 time frames may have more false entry points.
- All
- All
- Bearish Rectangle
- Bearish Symmetrical Triangle
- Bearish Symmetrical Triangle
- Bullish Rectangle
- Double Top
- Double Top
- Triple Bottom
- Triple Bottom
- Triple Top
- Triple Top
- All
- All
- Buy
- Sale
- All
- 1
- 2
- 3
- 4
- 5
Panji Bullish
was formed on 13.05 at 21:30:25 (UTC+0)
signal strength 4 of 5
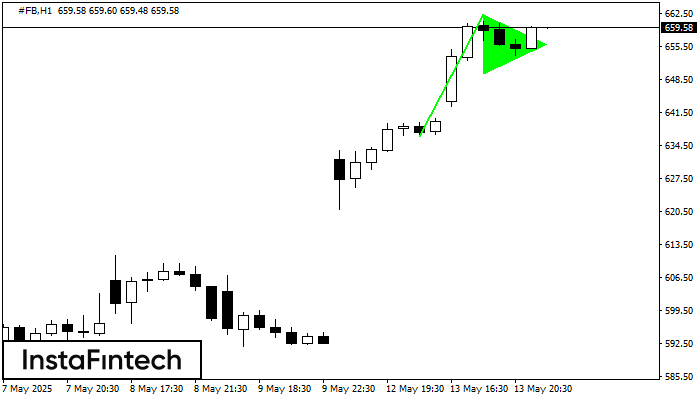
Sinyal Panji Bullish – instrumen trading #FB H1, pola kelanjutan. Prakiraan: mungkin untuk mengatur posisi beli di atas titik tertinggi pola, di 662.37, dengan prospek pergerakan selanjutnya menjadi proyeksi titik
Open chart in a new window
Bendera Bullish
was formed on 13.05 at 21:28:24 (UTC+0)
signal strength 1 of 5
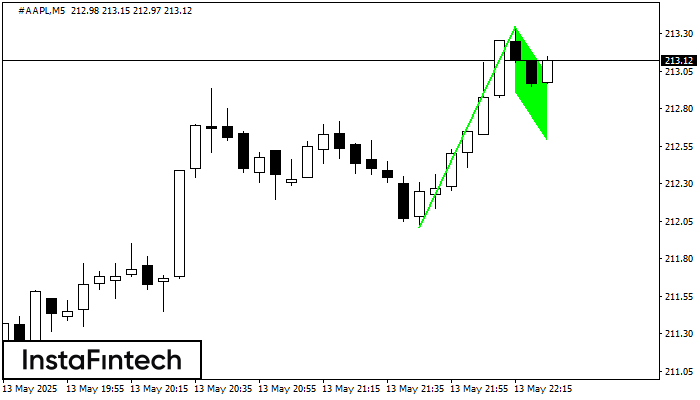
Pola Bendera Bullish telah terbentuk di #AAPL at M5. Batas bawah pola ini terletak di 212.91/212.59, sementara batas atas terletak di 213.35/213.03. Proyeksi panjang jarum candle 134 poin. Pembentukan
Rangka waktu M5 dan M15 mungkin memiliki lebih dari titik entri yang keliru.
Open chart in a new window
Panji Bullish
was formed on 13.05 at 21:28:19 (UTC+0)
signal strength 1 of 5
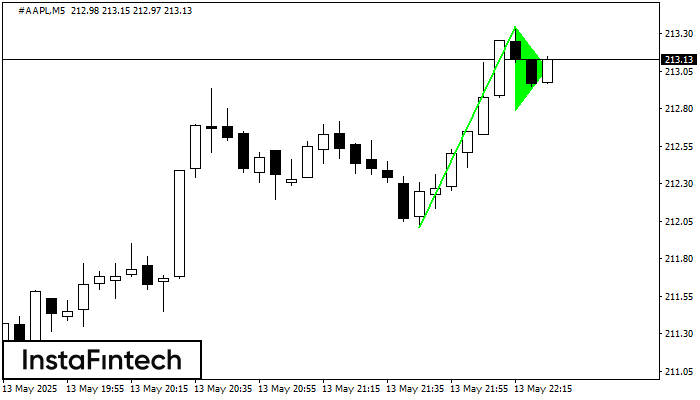
Sinyal Panji Bullish – instrumen trading #AAPL M5, pola kelanjutan. Prakiraan: mungkin untuk mengatur posisi beli di atas titik tertinggi pola, di 213.35, dengan prospek pergerakan selanjutnya menjadi proyeksi titik
Rangka waktu M5 dan M15 mungkin memiliki lebih dari titik entri yang keliru.
Open chart in a new window


