

Actual patterns

Patterns are graphical models which are formed in the chart by the price. According to one of the technical analysis postulates, history (price movement) repeats itself. It means that the price movements are often similar in the same situations which makes it possible to predict the further development of the situation with a high probability.
Relevant patterns by InstaTrade is an easy-to-use service which allows you to be aware of latest changes in the market and react to clues from the market in time. In our service you will always find the latest and most relevant patterns on any pair and any timeframe.
Inverse Head and Shoulder
was formed on 27.03 at 03:05:48 (UTC+0)
signal strength 1 of 5

According to the chart of M5, NZDUSD formed the Inverse Head and Shoulder pattern. The Head’s top is set at 0.5723 while the median line of the Neck is found at 0.5705/0.5719. The formation of the Inverse Head and Shoulder pattern evidently signals a reversal of the downward trend. In other words, in case the scenario comes true, the price of NZDUSD will go towards 0.5738
The M5 and M15 time frames may have more false entry points.
See Also
- All
- All
- Bearish Rectangle
- Bearish Symmetrical Triangle
- Bearish Symmetrical Triangle
- Bullish Rectangle
- Double Top
- Double Top
- Triple Bottom
- Triple Bottom
- Triple Top
- Triple Top
- All
- All
- Buy
- Sale
- All
- 1
- 2
- 3
- 4
- 5
Fundo triplo
was formed on 28.05 at 21:05:58 (UTC+0)
signal strength 1 of 5
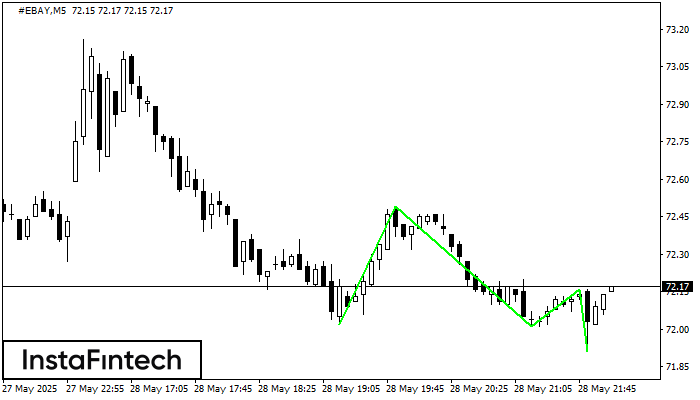
O padrão Fundo triplo foi formado no gráfico do instrumento de negociação #EBAY M5. O padrão sinaliza uma mudança na tendência de baixa para alta no caso de quebra
Os intervalos M5 e M15 podem ter mais pontos de entrada falsos.
Open chart in a new window
Topo duplo
was formed on 28.05 at 21:00:23 (UTC+0)
signal strength 3 of 5
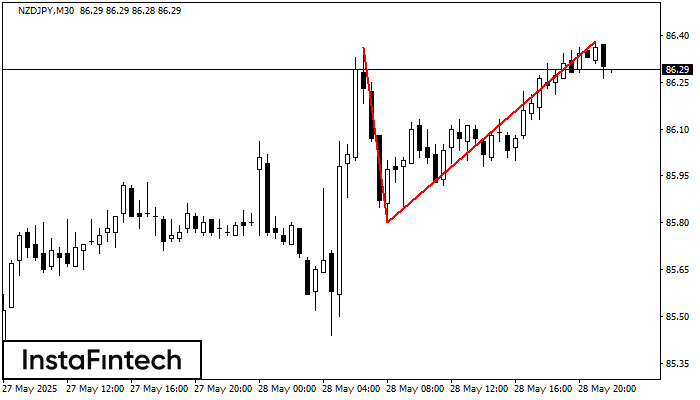
No gráfico de NZDJPY M30 o padrão de reversão Topo duplo foi formado. Características: o limite superior 86.38; o limite inferior 85.80; a largura do padrão 58 pontos. O sinal
Open chart in a new window
Fundo duplo
was formed on 28.05 at 20:55:28 (UTC+0)
signal strength 1 of 5
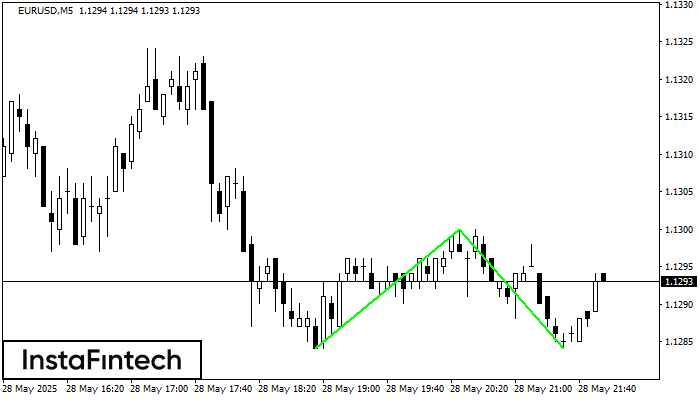
O padrão Fundo duplo foi formado em EURUSD M5. Características: o nível de suporte 1.1284; o nível de resistência 1.1300; a largura do padrão 16 pontos. Se o nível
Os intervalos M5 e M15 podem ter mais pontos de entrada falsos.
Open chart in a new window


