

Actual patterns

Patterns are graphical models which are formed in the chart by the price. According to one of the technical analysis postulates, history (price movement) repeats itself. It means that the price movements are often similar in the same situations which makes it possible to predict the further development of the situation with a high probability.
Relevant patterns by InstaTrade is an easy-to-use service which allows you to be aware of latest changes in the market and react to clues from the market in time. In our service you will always find the latest and most relevant patterns on any pair and any timeframe.
Bullish Symmetrical Triangle
was formed on 25.03 at 22:45:42 (UTC+0)
signal strength 1 of 5
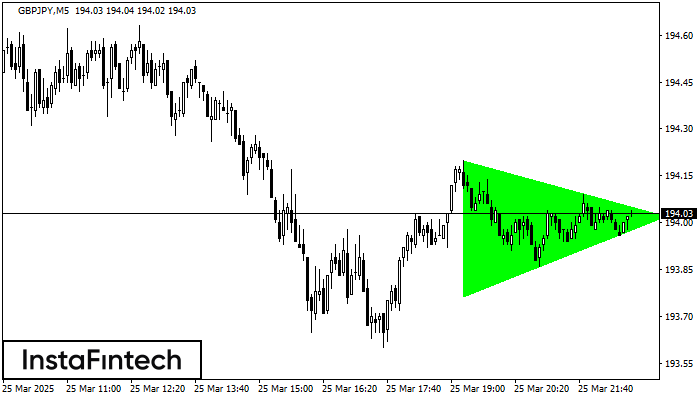
According to the chart of M5, GBPJPY formed the Bullish Symmetrical Triangle pattern, which signals the trend will continue. Description. The upper border of the pattern touches the coordinates 194.20/194.02 whereas the lower border goes across 193.77/194.02. The pattern width is measured on the chart at 43 pips. If the Bullish Symmetrical Triangle pattern is in progress during the upward trend, this indicates the current trend will go on. In case 194.02 is broken, the price could continue its move toward 194.17.
The M5 and M15 time frames may have more false entry points.
- All
- All
- Bearish Rectangle
- Bearish Symmetrical Triangle
- Bearish Symmetrical Triangle
- Bullish Rectangle
- Double Top
- Double Top
- Triple Bottom
- Triple Bottom
- Triple Top
- Triple Top
- All
- All
- Buy
- Sale
- All
- 1
- 2
- 3
- 4
- 5
Медвежий симметричный треугольник
сформирован 07.05 в 15:29:43 (UTC+0)
сила сигнала 2 из 5
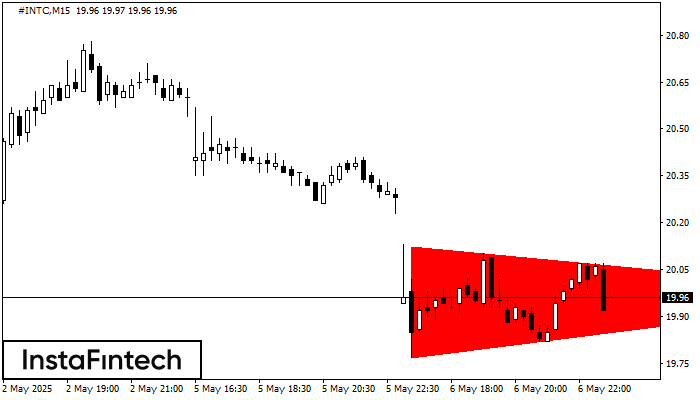
На графике #INTC на M15 сформировалась фигура «Медвежий симметричный треугольник». Торговые рекомендации: Пробой нижней границы 19.77 с большой долей вероятности приведет к продолжению нисходящего тренда
Таймфреймы М5 и М15 могут иметь больше ложных точек входа.
Открыть график инструмента в новом окне
Медвежий симметричный треугольник
сформирован 07.05 в 15:22:28 (UTC+0)
сила сигнала 2 из 5
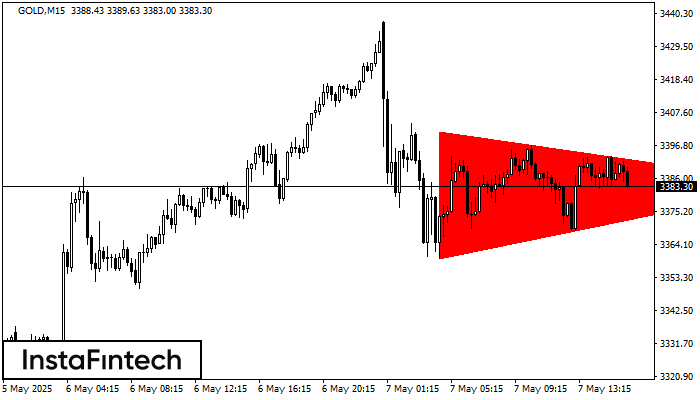
По GOLD M15 сформировалась фигура «Медвежий симметричный треугольник». Данная фигура сигнализирует нам о продолжении нисходящего тренда в случае пробоя нижней границы 3359.66, где вероятная прибыль будет являться шириной текущей фигуры
Таймфреймы М5 и М15 могут иметь больше ложных точек входа.
Открыть график инструмента в новом окне
Бычий вымпел
сформирован 07.05 в 15:02:22 (UTC+0)
сила сигнала 2 из 5
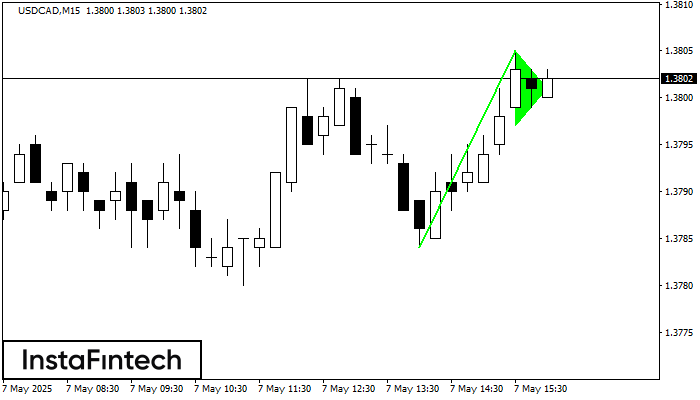
На графике USDCAD M15 сформировался паттерн «Бычий вымпел», который относится к фигуре продолжения тренда. Можно предполагать, что, в случае фиксации цены выше максимума вымпела 1.3805, возможно дальнейшее восходящее движение
Таймфреймы М5 и М15 могут иметь больше ложных точек входа.
Открыть график инструмента в новом окне


