

Actual patterns

Patterns are graphical models which are formed in the chart by the price. According to one of the technical analysis postulates, history (price movement) repeats itself. It means that the price movements are often similar in the same situations which makes it possible to predict the further development of the situation with a high probability.
Relevant patterns by InstaTrade is an easy-to-use service which allows you to be aware of latest changes in the market and react to clues from the market in time. In our service you will always find the latest and most relevant patterns on any pair and any timeframe.
Double Bottom
was formed on 16.04 at 00:35:20 (UTC+0)
signal strength 1 of 5

The Double Bottom pattern has been formed on #Bitcoin M5; the upper boundary is 84198.05; the lower boundary is 83772.49. The width of the pattern is 43677 points. In case of a break of the upper boundary 84198.05, a change in the trend can be predicted where the width of the pattern will coincide with the distance to a possible take profit level.
The M5 and M15 time frames may have more false entry points.
- All
- All
- Bearish Rectangle
- Bearish Symmetrical Triangle
- Bearish Symmetrical Triangle
- Bullish Rectangle
- Double Top
- Double Top
- Triple Bottom
- Triple Bottom
- Triple Top
- Triple Top
- All
- All
- Buy
- Sale
- All
- 1
- 2
- 3
- 4
- 5
Double Bottom
was formed on 30.05 at 09:30:30 (UTC+0)
signal strength 1 of 5
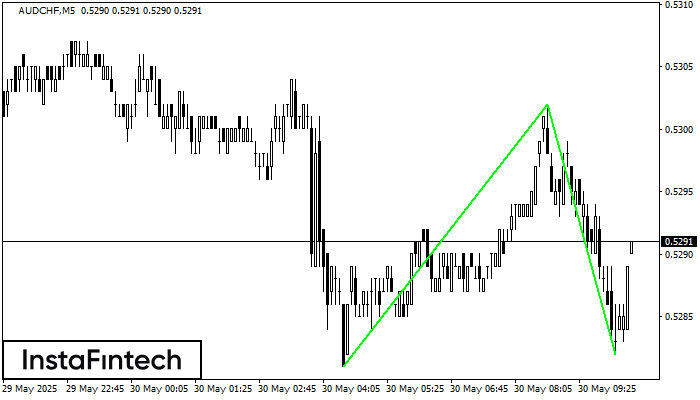
Corak Double Bottom telah dibentuk pada AUDCHF M5. Ciri-ciri: tahap sokongan 0.5281; tahap rintangan 0.5302; lebar corak 21 mata. Sekiranya tahap rintangan ditembusi, perubahan aliran boleh diramalkan dengan titik sasaran
Carta masa M5 dan M15 mungkin mempunyai lebih banyak titik kemasukan palsu.
Open chart in a new window
Double Bottom
was formed on 30.05 at 09:30:14 (UTC+0)
signal strength 2 of 5
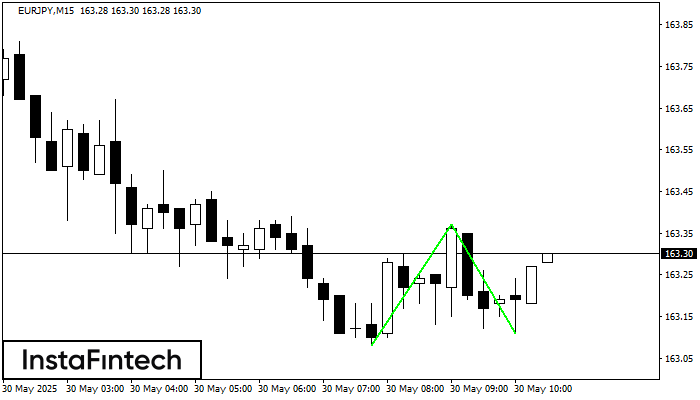
Corak Double Bottom telah dibentuk pada EURJPY M15. Ciri-ciri: tahap sokongan 163.08; tahap rintangan 163.37; lebar corak 29 mata. Sekiranya tahap rintangan ditembusi, perubahan aliran boleh diramalkan dengan titik sasaran
Carta masa M5 dan M15 mungkin mempunyai lebih banyak titik kemasukan palsu.
Open chart in a new window
Triple Bottom
was formed on 30.05 at 09:00:12 (UTC+0)
signal strength 4 of 5
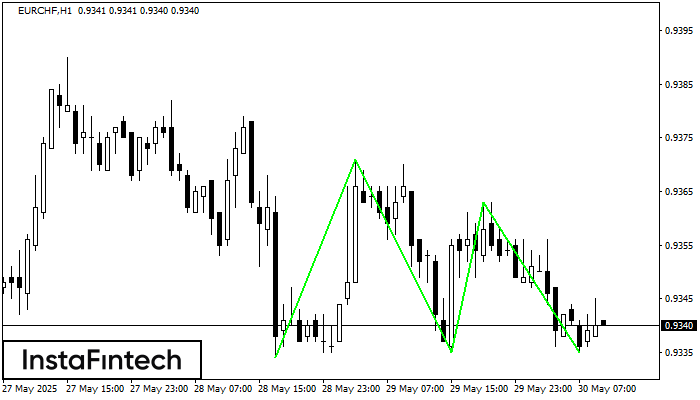
Corak Triple Bottom telah dibentuk pada carta EURCHF H1. Ciri-ciri corak: Garisan bawah corak mempunyai koordinat 0.9371 dengan had atas 0.9371/0.9363, unjuran lebar adalah 37 mata. Pembentukan corak Triple Bottom
Open chart in a new window


