

Actual patterns

Patterns are graphical models which are formed in the chart by the price. According to one of the technical analysis postulates, history (price movement) repeats itself. It means that the price movements are often similar in the same situations which makes it possible to predict the further development of the situation with a high probability.
Relevant patterns by InstaTrade is an easy-to-use service which allows you to be aware of latest changes in the market and react to clues from the market in time. In our service you will always find the latest and most relevant patterns on any pair and any timeframe.
Bearish Rectangle
was formed on 11.04 at 22:10:27 (UTC+0)
signal strength 1 of 5

According to the chart of M5, USDCAD formed the Bearish Rectangle which is a pattern of a trend continuation. The pattern is contained within the following borders: lower border 1.3871 – 1.3871 and upper border 1.3891 – 1.3891. In case the lower border is broken, the instrument is likely to follow the downward trend.
The M5 and M15 time frames may have more false entry points.
- All
- All
- Bearish Rectangle
- Bearish Symmetrical Triangle
- Bearish Symmetrical Triangle
- Bullish Rectangle
- Double Top
- Double Top
- Triple Bottom
- Triple Bottom
- Triple Top
- Triple Top
- All
- All
- Buy
- Sale
- All
- 1
- 2
- 3
- 4
- 5
Fundo duplo
was formed on 25.04 at 05:00:18 (UTC+0)
signal strength 1 of 5
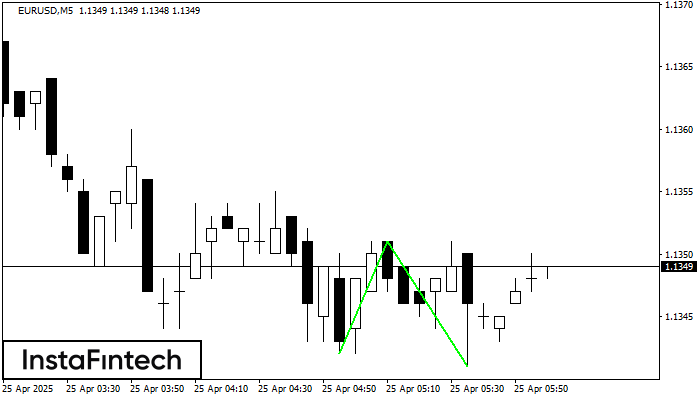
O padrão Fundo duplo foi formado em EURUSD M5. Características: o nível de suporte 1.1342; o nível de resistência 1.1351; a largura do padrão 9 pontos. Se o nível
Os intervalos M5 e M15 podem ter mais pontos de entrada falsos.
Open chart in a new window
Fundo duplo
was formed on 25.04 at 04:55:36 (UTC+0)
signal strength 1 of 5
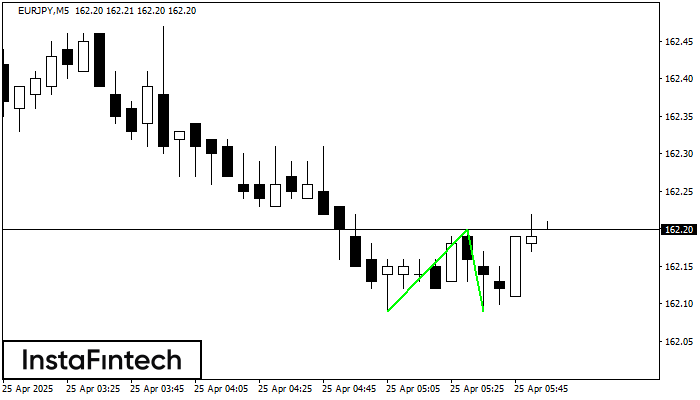
O padrão Fundo duplo foi formado em EURJPY M5. Características: o nível de suporte 162.09; o nível de resistência 162.20; a largura do padrão 11 pontos. Se o nível
Os intervalos M5 e M15 podem ter mais pontos de entrada falsos.
Open chart in a new window
Topo duplo
was formed on 25.04 at 04:10:51 (UTC+0)
signal strength 1 of 5
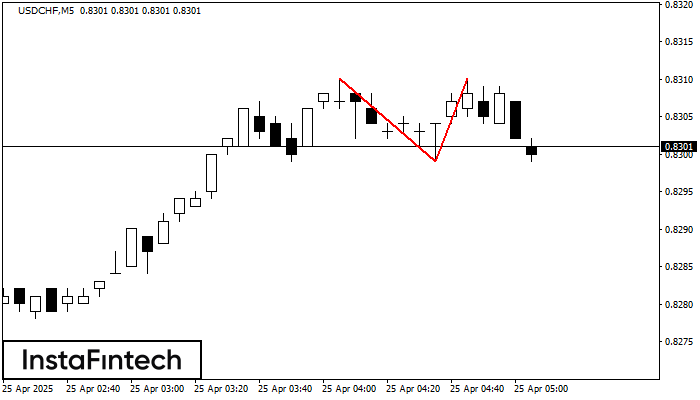
O padrão de reversão Topo duplo foi formado em USDCHF M5. Características: o limite superior 0.8310; o limite inferior 0.8299; a largura do padrão é de 11 pontos. As operações
Os intervalos M5 e M15 podem ter mais pontos de entrada falsos.
Open chart in a new window


