

Actual patterns

Patterns are graphical models which are formed in the chart by the price. According to one of the technical analysis postulates, history (price movement) repeats itself. It means that the price movements are often similar in the same situations which makes it possible to predict the further development of the situation with a high probability.
Relevant patterns by InstaTrade is an easy-to-use service which allows you to be aware of latest changes in the market and react to clues from the market in time. In our service you will always find the latest and most relevant patterns on any pair and any timeframe.
Double Top
was formed on 07.04 at 21:15:26 (UTC+0)
signal strength 2 of 5
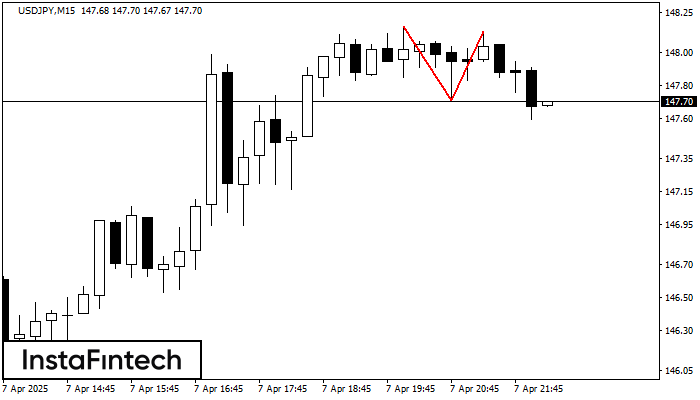
On the chart of USDJPY M15 the Double Top reversal pattern has been formed. Characteristics: the upper boundary 148.13; the lower boundary 147.71; the width of the pattern 42 points. The signal: a break of the lower boundary will cause continuation of the downward trend targeting the 147.49 level.
The M5 and M15 time frames may have more false entry points.
- All
- All
- Bearish Rectangle
- Bearish Symmetrical Triangle
- Bearish Symmetrical Triangle
- Bullish Rectangle
- Double Top
- Double Top
- Triple Bottom
- Triple Bottom
- Triple Top
- Triple Top
- All
- All
- Buy
- Sale
- All
- 1
- 2
- 3
- 4
- 5
Retângulo de alta
was formed on 25.05 at 07:55:30 (UTC+0)
signal strength 1 of 5

De acordo com o gráfico de M5, #Bitcoin formou o Retângulo de alta que é um padrão de uma continuação da tendência. O padrão está dentro dos seguintes limites
Os intervalos M5 e M15 podem ter mais pontos de entrada falsos.
Open chart in a new window
Triângulo Simétrico de Alta
was formed on 24.05 at 18:46:25 (UTC+0)
signal strength 2 of 5

De acordo com o gráfico de M15, #Bitcoin formou o padrão de Triângulo Simétrico de Alta, sinalizando que a tendência continuará. Descrição: O limite superior do padrão toca as coordenadas
Os intervalos M5 e M15 podem ter mais pontos de entrada falsos.
Open chart in a new window
Retângulo de baixa
was formed on 23.05 at 23:00:20 (UTC+0)
signal strength 1 of 5

De acordo com o gráfico de M5, EURNZD formou Retângulo de baixa. O padrão indica uma continuação da tendência. O limite superior é 1.8982, o limite inferior é 1.8964
Os intervalos M5 e M15 podem ter mais pontos de entrada falsos.
Open chart in a new window


