

Actual patterns

Patterns are graphical models which are formed in the chart by the price. According to one of the technical analysis postulates, history (price movement) repeats itself. It means that the price movements are often similar in the same situations which makes it possible to predict the further development of the situation with a high probability.
Relevant patterns by InstaTrade is an easy-to-use service which allows you to be aware of latest changes in the market and react to clues from the market in time. In our service you will always find the latest and most relevant patterns on any pair and any timeframe.
Double Bottom
was formed on 25.03 at 19:15:33 (UTC+0)
signal strength 2 of 5
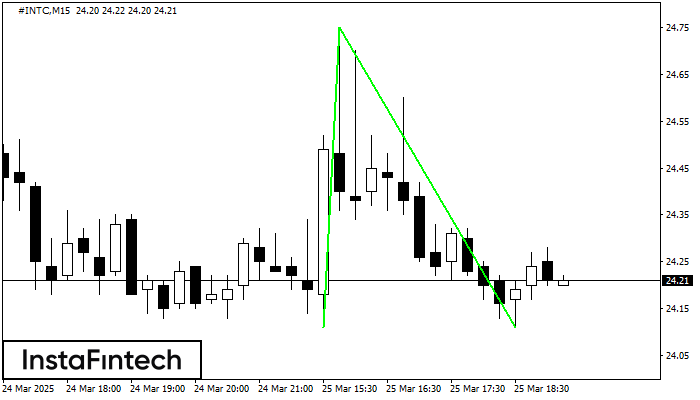
The Double Bottom pattern has been formed on #INTC M15; the upper boundary is 24.75; the lower boundary is 24.11. The width of the pattern is 64 points. In case of a break of the upper boundary 24.75, a change in the trend can be predicted where the width of the pattern will coincide with the distance to a possible take profit level.
The M5 and M15 time frames may have more false entry points.
See Also
- All
- All
- Bearish Rectangle
- Bearish Symmetrical Triangle
- Bearish Symmetrical Triangle
- Bullish Rectangle
- Double Top
- Double Top
- Triple Bottom
- Triple Bottom
- Triple Top
- Triple Top
- All
- All
- Buy
- Sale
- All
- 1
- 2
- 3
- 4
- 5
Bearish pennant
was formed on 14.05 at 21:47:56 (UTC+0)
signal strength 4 of 5
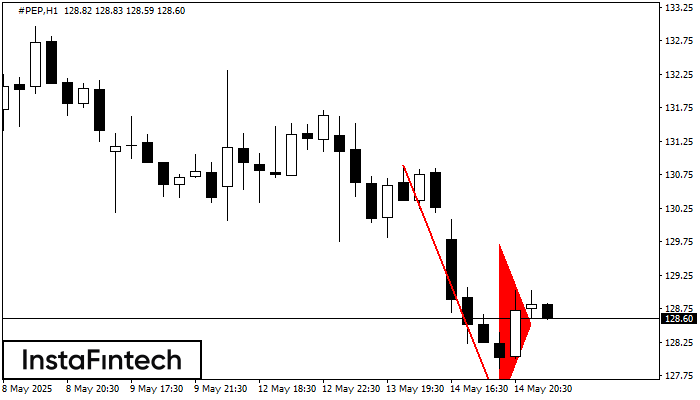
The Bearish pennant pattern has formed on the #PEP H1 chart. It signals potential continuation of the existing trend. Specifications: the pattern’s bottom has the coordinate of 127.29; the projection
Open chart in a new window
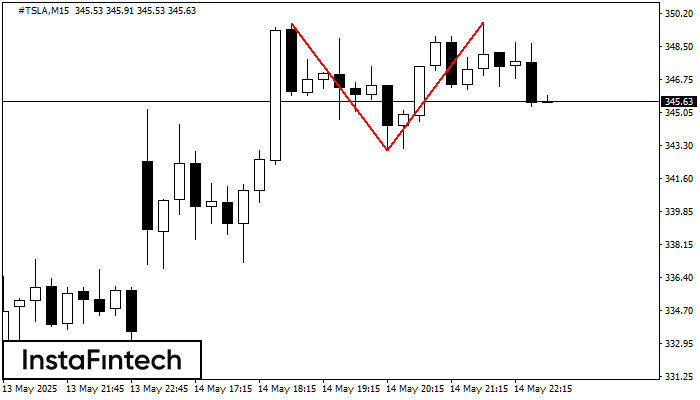
Double Top
was formed on 14.05 at 21:45:26 (UTC+0)
signal strength 2 of 5

The Double Top reversal pattern has been formed on #TSLA M15. Characteristics: the upper boundary 349.70; the lower boundary 343.02; the width of the pattern is 669 points. Sell trades
The M5 and M15 time frames may have more false entry points.
Open chart in a new window
Double Top
was formed on 14.05 at 21:45:24 (UTC+0)
signal strength 2 of 5
The Double Top reversal pattern has been formed on #TSLA M15. Characteristics: the upper boundary 349.70; the lower boundary 343.02; the width of the pattern is 669 points. Sell trades
The M5 and M15 time frames may have more false entry points.
Open chart in a new window
Bullish Symmetrical Triangle
was formed on 14.05 at 21:36:24 (UTC+0)
signal strength 1 of 5
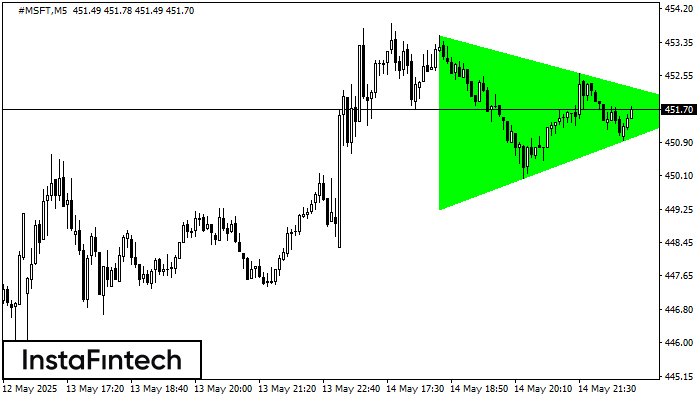
According to the chart of M5, #MSFT formed the Bullish Symmetrical Triangle pattern. Description: This is the pattern of a trend continuation. 453.52 and 449.26 are the coordinates
The M5 and M15 time frames may have more false entry points.
Open chart in a new window
Triple Bottom
was formed on 14.05 at 21:30:27 (UTC+0)
signal strength 1 of 5
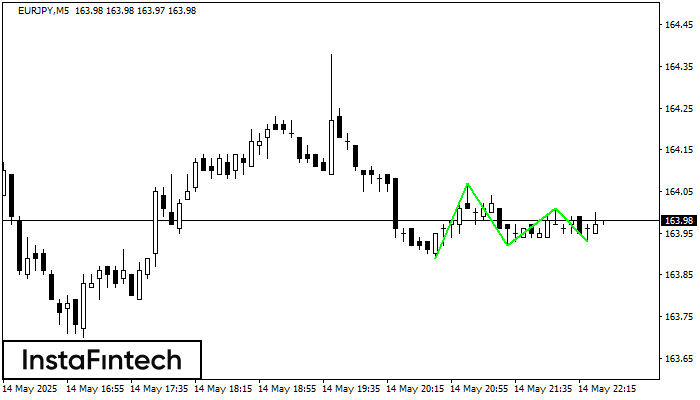
The Triple Bottom pattern has been formed on EURJPY M5. It has the following characteristics: resistance level 164.07/164.01; support level 163.89/163.93; the width is 18 points. In the event
The M5 and M15 time frames may have more false entry points.
Open chart in a new window
Triple Top
was formed on 14.05 at 21:30:14 (UTC+0)
signal strength 2 of 5
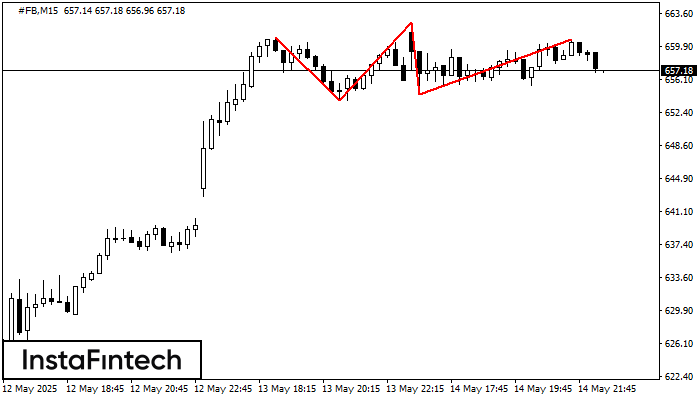
The Triple Top pattern has formed on the chart of the #FB M15. Features of the pattern: borders have an ascending angle; the lower line of the pattern
The M5 and M15 time frames may have more false entry points.
Open chart in a new window
Double Top
was formed on 14.05 at 20:35:16 (UTC+0)
signal strength 1 of 5
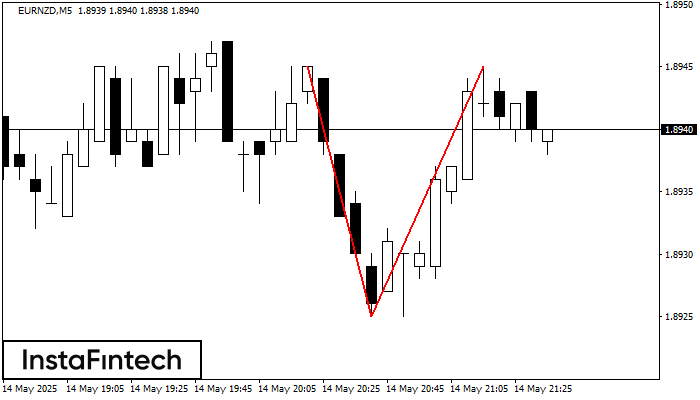
The Double Top reversal pattern has been formed on EURNZD M5. Characteristics: the upper boundary 1.8945; the lower boundary 1.8925; the width of the pattern is 20 points. Sell trades
The M5 and M15 time frames may have more false entry points.
Open chart in a new window
Bearish Rectangle
was formed on 14.05 at 19:42:39 (UTC+0)
signal strength 1 of 5
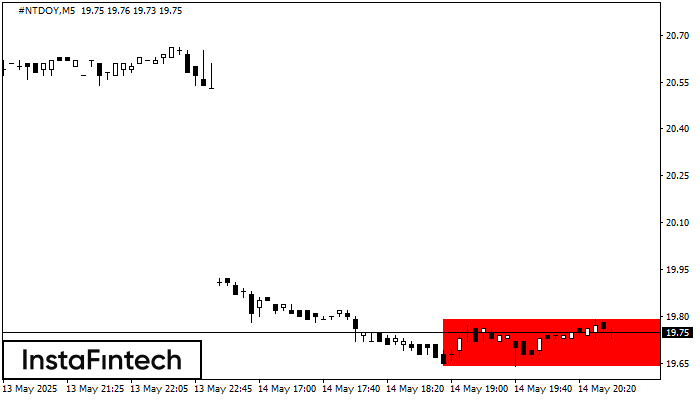
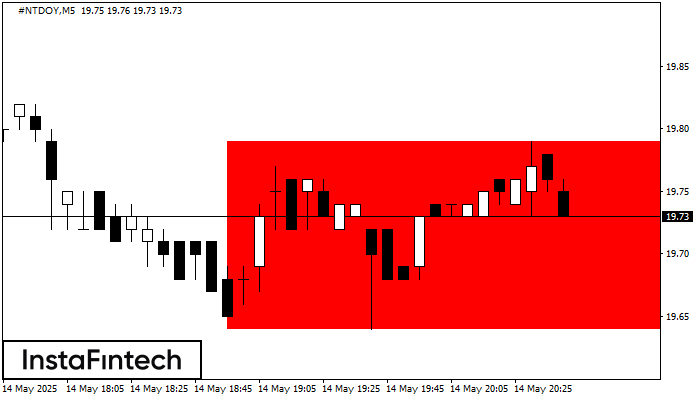
According to the chart of M5, #NTDOY formed the Bearish Rectangle. The pattern indicates a trend continuation. The upper border is 19.79, the lower border is 19.64. The signal means
The M5 and M15 time frames may have more false entry points.
Open chart in a new window
Bearish Rectangle
was formed on 14.05 at 19:42:36 (UTC+0)
signal strength 1 of 5
According to the chart of M5, #NTDOY formed the Bearish Rectangle. The pattern indicates a trend continuation. The upper border is 19.79, the lower border is 19.64. The signal means
The M5 and M15 time frames may have more false entry points.
Open chart in a new window


