Voir aussi


 29.01.2024 10:42 AM
The economic calendar lacked high-impact data on Friday.
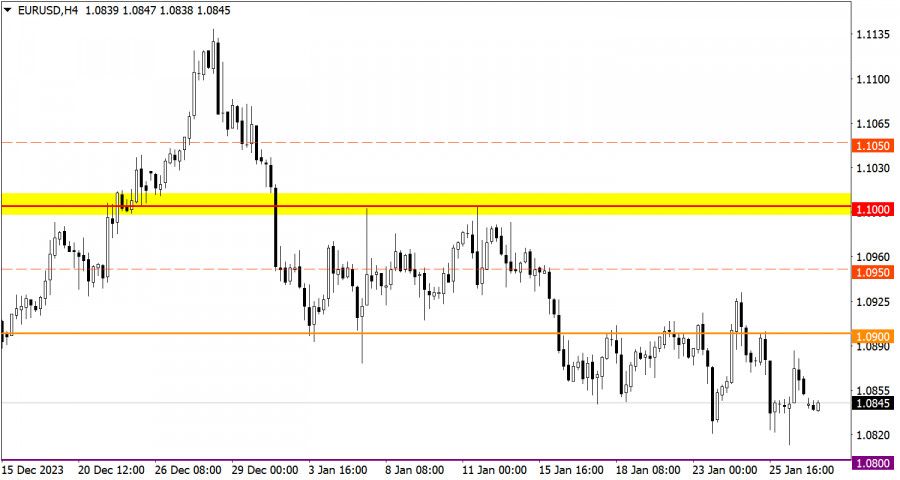
EUR/USD reached the bottom of the correction cycle accompanied by pronounced speculative activity.
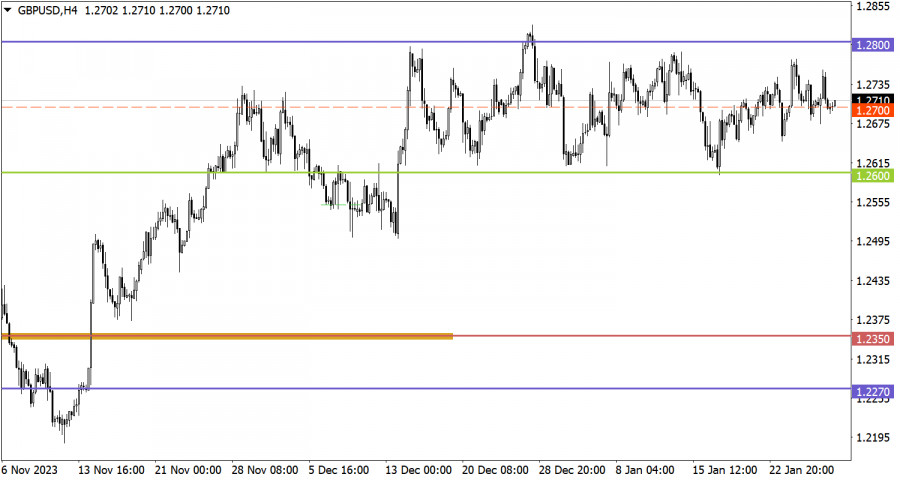
The GBP/USD pair had been trapped within the sideways channel between 1.2600 and 1.2800 for the seventh week in a row. There is periodic speculative activity, but special attention is paid to the middle level of the sideways channel at 1.2700.
Traditionally, the new trading week begins with the empty economic calendar. This is common for Monday. Nevertheless, this week is going to be jam-packed with major events. Two central banks are holding policy meetings. As for macroeconomic data, the market will get to know inflation data for the EU and the US nonfarm payrolls for January.
The extension of the downward correction indicates the overall bearish interest among market participants. However, as before, the level of 1.0800 serves as an obstacle for the sellers, which, according to technical analysis, can put pressure on short positions. Thus, the downward cycle is limited to this level, which means some uncertainty in market sentiment. If the price settles below 1.0800 during the day, traders may add short positions.
The median level acts as an indicator of trading interest within the sideways channel. Price stabilization below this level may be followed by a movement towards the lower border of 1.2600. However, all price fluctuations so far fit within the current corridor, which, is still in the making according to technical analysis. A priority strategy among market participants is trading during a breakout of one of the borders of the sideways channel.
The candlestick chart type consists of graphic rectangles in white and black with lines at the top and bottom. With a detailed analysis of each individual candle, you can see its characteristics relative to a particular time period: opening price, closing price, maximum and minimum price.
Horizontal levels are price coordinates relative to which a price may stop or revered its trajectory. In the market, these levels are called support and resistance.
Circles and rectangles are highlighted examples where the price developed. This color highlighting indicates horizontal lines that may put pressure on the price in the future.
Up/down arrows are guidelines for a possible direction in the future.
You have already liked this post today
*The market analysis posted here is meant to increase your awareness, but not to give instructions to make a trade.
Lundi, la paire GBP/USD a augmenté de 130 pips. C'était donc ce « lundi ennuyeux » sans rapport macroéconomique ni discours important. La livre sterling a gagné plus d'un centime
Le lundi, la paire de devises EUR/USD a montré des mouvements quelque peu mitigés, peu importe comment vous la regardez. D'une part, la paire a démontré une forte hausse malgré
Ce lundi, la paire de devises GBP/USD a de nouveau progressé malgré l'absence de raisons fondamentales. Cependant, d'ici là, tous les traders devraient être habitués à de telles évolutions. Alors
Ce lundi, le couple de devises EUR/USD a montré un mouvement à la hausse relativement appréciable au cours de la journée, mais est resté à l'intérieur du canal étroit entre
Dans ma prévision matinale, je me suis concentré sur le niveau de 1.3342 et j'avais prévu de prendre des décisions de trading en fonction de celui-ci. Regardons le graphique
Dans ma prévision du matin, je me suis concentré sur le niveau de 1.1391 et j'ai prévu de prendre des décisions de trading à partir de là. Regardons le graphique
La paire GBP/USD n'a pas non plus montré de mouvements intéressants vendredi. À l'instar de l'euro, la livre britannique est restée très proche d'une fourchette plate. Cependant, la monnaie britannique
La paire de devises EUR/USD a continué de stagner vendredi. Le marché continue d'ignorer toutes les données macroéconomiques, et la semaine dernière a une fois de plus confirmé ce fait
La paire de devises GBP/USD a poursuivi un mouvement latéral ce vendredi, se maintenant près des plus hauts de trois ans. Le fait que la livre sterling refuse même
Your IP address shows that you are currently located in the USA. If you are a resident of the United States, you are prohibited from using the services of InstaFintech Group including online trading, online transfers, deposit/withdrawal of funds, etc.
If you think you are seeing this message by mistake and your location is not the US, kindly proceed to the website. Otherwise, you must leave the website in order to comply with government restrictions.
Why does your IP address show your location as the USA?
Please confirm whether you are a US resident or not by clicking the relevant button below. If you choose the wrong option, being a US resident, you will not be able to open an account with InstaTrade anyway.
We are sorry for any inconvenience caused by this message.


