See also


 30.04.2025 06:04 AM
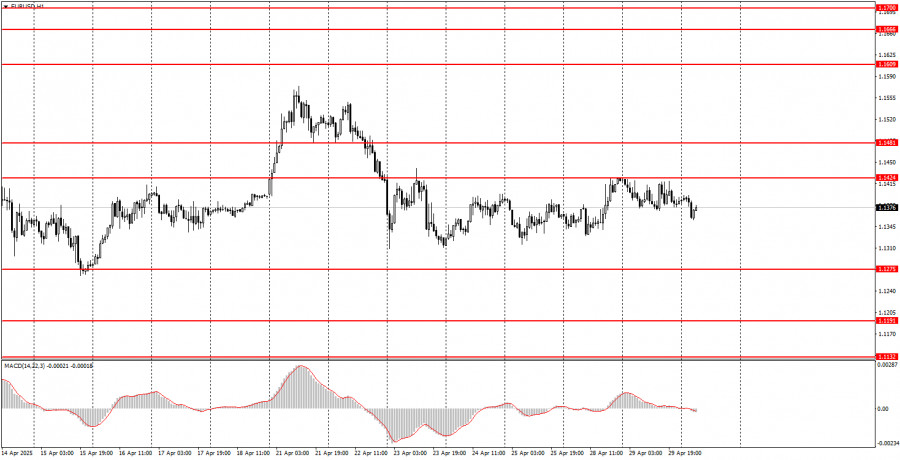
On Tuesday, the EUR/USD currency pair continued to trade within a sideways channel, which is now visible on virtually any timeframe and easily recognized even at a glance. As a reminder, at the beginning of last week, the price briefly exited this range — as usual, due to Donald Trump. The U.S. president first decided to fire Federal Reserve Chair Jerome Powell, then changed his mind the next day. We believe such news carried no real significance, as Trump has no direct power over the Fed. Nevertheless, the market reacted to both events, which led to the breakout and the subsequent return to the channel. Excluding those moves, the pair has been in a flat range for three weeks now. Nothing changed yesterday, and traders once again ignored the macroeconomic background. The only somewhat meaningful report — U.S. JOLTS job openings — came in weaker than expected, which wasn't surprising. However, the dollar showed no significant decline in response.
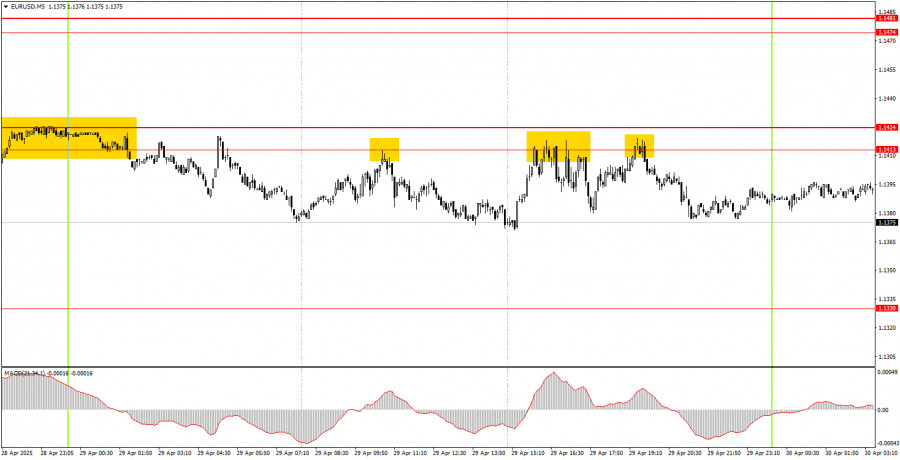
On Tuesday, three identical trading signals were formed in the 5-minute timeframe. The price bounced off the 1.1413–1.1424 zone three times, but volatility was weak, so each time, the price moved about 30 pips in the intended direction before returning to its original level.
On the hourly timeframe, EUR/USD maintains a bullish trend. However, if we exclude the movements from the beginning of last week, the market has been flat for three weeks. Overall, market sentiment remains extremely negative toward the U.S. dollar and all things American. Still, if Trump shifts toward de-escalating the very trade conflict he initiated, the dollar could improve its position. Whether that will happen—or when—remains unknown.
On Wednesday, the pair may again move in either direction, as market movements depend entirely on Trump's statements and decisions. We believe the flat phase will continue for a while longer.
On the 5-minute timeframe, the key levels to watch are: 1.0940–1.0952, 1.1011, 1.1091, 1.1132–1.1140, 1.1189–1.1191, 1.1275–1.1292, 1.1330, 1.1413–1.1424, 1.1474–1.1481, 1.1513, 1.1548, 1.1571, 1.1607–1.1622, 1.1666, 1.1689. On Wednesday, the Eurozone is scheduled to release a considerable amount of macroeconomic data, including German retail sales, unemployment, inflation, and GDP, as well as Eurozone GDP. In the U.S., we'll see GDP and ADP reports. These are significant releases, but we strongly doubt that the market will pay attention to macroeconomic data today.
Support and Resistance Levels: These are target levels for opening or closing positions and can also serve as points for placing Take Profit orders.
Red Lines: Channels or trendlines indicating the current trend and the preferred direction for trading.
MACD Indicator (14,22,3): A histogram and signal line used as a supplementary source of trading signals.
Important Events and Reports: Found in the economic calendar, these can heavily influence price movements. Exercise caution or exit the market during their release to avoid sharp reversals.
Forex trading beginners should remember that not every trade will be profitable. Developing a clear strategy and practicing proper money management are essential for long-term trading success.
You have already liked this post today
*The market analysis posted here is meant to increase your awareness, but not to give instructions to make a trade.
In my morning forecast, I highlighted the 1.1379 level and planned to base market entry decisions around it. Let's look at the 5-minute chart to understand what happened. A rise
Analysis of Tuesday's Trades 1H Chart of GBP/USD The GBP/USD pair exhibited a notable upward movement on Tuesday, although it remains within a sideways channel that may not be immediately
Analysis of Tuesday's Trades 1H Chart of EUR/USD On Tuesday, the EUR/USD currency pair traded completely flat. Throughout the day, there were no significant reports or events either
On Tuesday, the GBP/USD currency pair suddenly and unexpectedly resumed upward movement. While the euro was stuck in a flat market, the British pound showed a strong rally, and again
Analysis of Monday's Trades 1H Chart of GBP/USD On Monday, the GBP/USD pair continued to trade strictly sideways. Although we don't see a clearly defined flat range for the pound
Analysis of Monday's Trades 1H Chart of EUR/USD On Monday, the EUR/USD currency pair once again traded both upward and downward, confirming the presence of a flat market. The price
Forex Chart
Web-version

Your IP address shows that you are currently located in the USA. If you are a resident of the United States, you are prohibited from using the services of InstaFintech Group including online trading, online transfers, deposit/withdrawal of funds, etc.
If you think you are seeing this message by mistake and your location is not the US, kindly proceed to the website. Otherwise, you must leave the website in order to comply with government restrictions.
Why does your IP address show your location as the USA?
Please confirm whether you are a US resident or not by clicking the relevant button below. If you choose the wrong option, being a US resident, you will not be able to open an account with InstaTrade anyway.
We are sorry for any inconvenience caused by this message.


