See also


 28.04.2025 05:51 AM
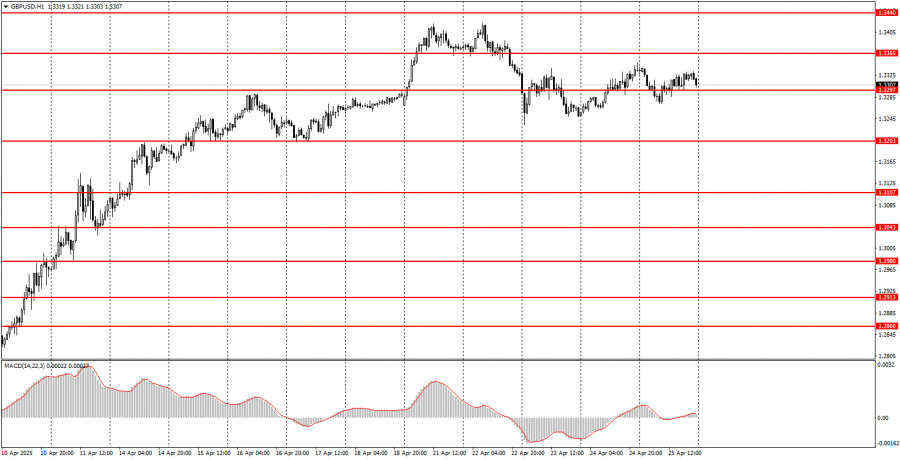
The GBP/USD pair also showed no interesting movements on Friday. Like the euro, the British pound remained very close to a flat range. However, the British currency still maintains a slight upward bias. The pound shows excellent resilience against the dollar and hardly declines against the U.S. currency. For most of last week, we also observed total flat trading with low volatility. Trump took a week-long pause from introducing new tariffs and sanctions, and important reports, such as business activity and durable goods orders, did not interest the market. Thus, the next movement can be expected when Trump delivers a new informational bomb to the markets. Recently, Trump has started to soften his rhetoric toward China and has assured that future relations between the countries will be excellent and that a trade deal will undoubtedly be reached. Meanwhile, China stated that it is not conducting negotiations with Trump.
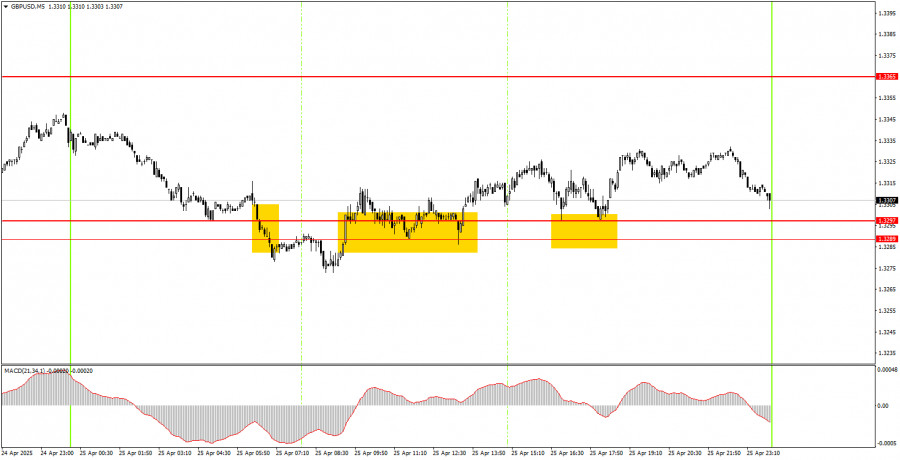
On the 5-minute timeframe on Friday, the price first consolidated below the 1.3289-1.3297 area, then above it, and later bounced off it four times from the top side. The maximum movement of the pair after the buy signals was approximately 25 pips. Thus, it was challenging to earn profits on Friday due to the lack of movement, but serious losses were also unlikely.
In the hourly timeframe, the GBP/USD pair could have started a downward trend long ago, but the market continues to focus solely on Trump, so the pound continues its steady upward climb. Thus, future movements of the pair continue to depend only on the American president and his decisions. Perhaps the market's attitude toward news will begin to change in the future, but nothing of the sort is observed.
The GBP/USD pair may move sideways on Monday with a slight upward bias. The market has again demonstrated that it is not ready to buy the dollar until the global trade war de-escalates. Therefore, a sideways or upward movement should be expected.
On the 5-minute timeframe, you can currently trade between the levels 1.2848–1.2860, 1.2913, 1.2980–1.2993, 1.3043, 1.3102–1.3107, 1.3145–1.3167, 1.3203, 1.3289–1.3297, 1.3365, 1.3421–1.3440, 1.3488, 1.3537, and 1.3580–1.3598. No significant events are scheduled for Monday in the U.S. or the U.K. Therefore, it is unlikely to expect strong, trending movements today. However, one should remember that Trump could provoke a "market flight" anytime.
Support and Resistance Levels: These are target levels for opening or closing positions and can also serve as points for placing Take Profit orders.
Red Lines: Channels or trendlines indicating the current trend and the preferred direction for trading.
MACD Indicator (14,22,3): A histogram and signal line used as a supplementary source of trading signals.
Important Events and Reports: Found in the economic calendar, these can heavily influence price movements. Exercise caution or exit the market during their release to avoid sharp reversals.
Forex trading beginners should remember that not every trade will be profitable. Developing a clear strategy and practicing proper money management are essential for long-term trading success.
You have already liked this post today
*The market analysis posted here is meant to increase your awareness, but not to give instructions to make a trade.
On Friday, the GBP/USD currency pair corrected against Monday's growth and the broader uptrend. There were no clear reasons for the movements on any day of the week—Monday through Friday
The EUR/USD currency pair generally continued its downward movement throughout Friday. The U.S. dollar has strengthened over the past week, but this growth seems to lack solid justification. On Monday
Analysis of Friday's Trades 1H Chart of EUR/USD On Friday, the EUR/USD currency pair continued to trade within the sideways channel between 1.1275 and 1.1424. In principle, there is little
In my morning forecast, I highlighted the 1.1337 level and planned to make market entry decisions based on it. Let's look at the 5-minute chart and analyze what happened there
Several entry points into the market were formed yesterday. Let's look at the 5-minute chart and break down what happened. I highlighted the 1.3282 level in my morning forecast
Yesterday, several entry points into the market were formed. Let's look at the 5-minute chart and analyze what happened. In my morning forecast, I highlighted the 1.1320 level
InstaTrade
video analytics

Your IP address shows that you are currently located in the USA. If you are a resident of the United States, you are prohibited from using the services of InstaFintech Group including online trading, online transfers, deposit/withdrawal of funds, etc.
If you think you are seeing this message by mistake and your location is not the US, kindly proceed to the website. Otherwise, you must leave the website in order to comply with government restrictions.
Why does your IP address show your location as the USA?
Please confirm whether you are a US resident or not by clicking the relevant button below. If you choose the wrong option, being a US resident, you will not be able to open an account with InstaTrade anyway.
We are sorry for any inconvenience caused by this message.


