See also


 25.04.2025 07:05 PM
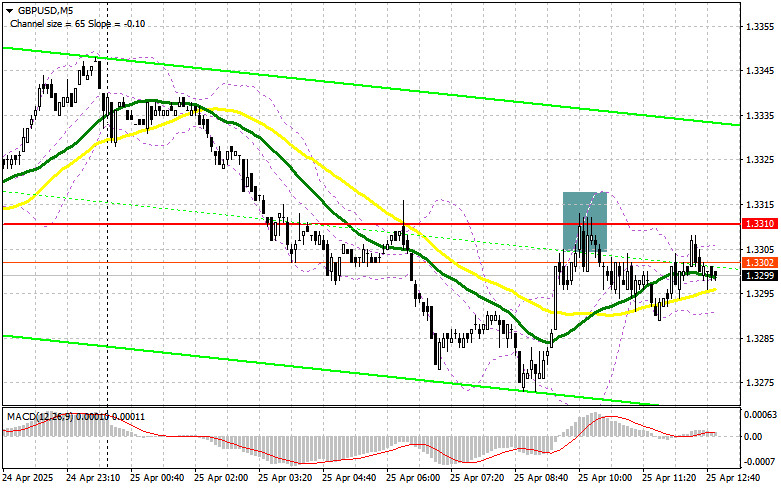
In my morning forecast, I focused on the 1.3310 level and planned to make trading decisions from there. Let's look at the 5-minute chart and see what happened. A rise and a false breakout near 1.3310 provided a sell entry point for the pound, which resulted in a 20-point drop, after which pressure on the pair eased. The technical outlook for the second half of the day has not been revised.
To Open Long Positions on GBP/USD:
An increase in UK retail sales triggered some buying of the pound in the first half of the day, but a strong bullish trend failed to materialize. Now, only strong data from the University of Michigan's consumer sentiment index and inflation expectations could put renewed pressure on the pair. Otherwise, the attempt to break out above 1.3310 may continue.
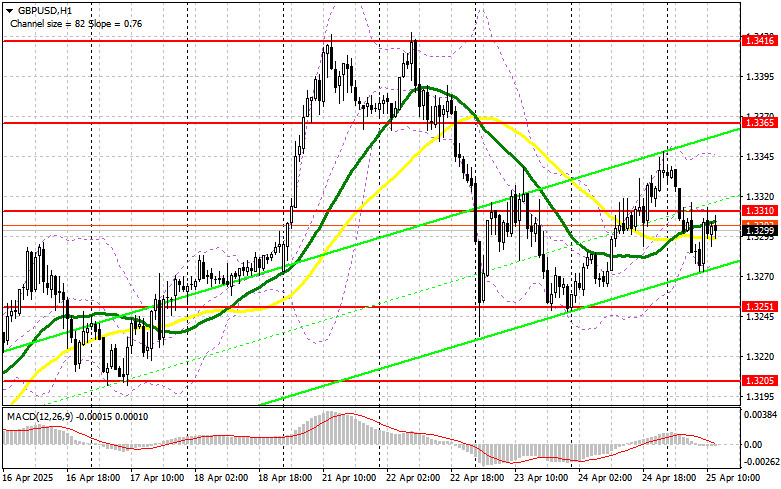
If the pair declines, I will act after a false breakout forms near the 1.3251 support level, established yesterday. This will offer a good long entry point with the goal of restoring the pair to resistance at 1.3310, where we spent most of today. A breakout and retest of this area from top to bottom will create another long entry opportunity aimed at updating 1.3365, potentially bringing back a bullish market. The furthest target will be the 1.3416 area, where I plan to take profit.
If GBP/USD falls and bulls are inactive near 1.3251 in the second half of the day, downward pressure will return. In that case, only a false breakout near 1.3205 will offer a proper long entry point. Otherwise, I'll look to buy GBP/USD on a rebound from support at 1.3165, aiming for a 30–35 point intraday correction.
To Open Short Positions on GBP/USD:
Sellers showed up in the first half of the day, but a stronger drop didn't materialize due to upbeat economic data. If the pound moves higher again following U.S. data, I'll act near the same resistance level of 1.3310. A false breakout there will provide a sell entry point aimed at a decline to the 1.3251 support level. A breakout and retest of this range from bottom to top will trigger stop-losses and open the way toward 1.3205. The final target will be the 1.3165 zone, where I will take profit.
If pound demand persists in the second half of the day and bears remain inactive near 1.3310—which coincides with the moving averages favoring sellers—then it's better to delay selling until testing the 1.3365 resistance. I'll open short positions there only after a false breakout. If there's no downside move from that level either, I'll look for shorts on a rebound from 1.3416, targeting a 30–35 point correction.
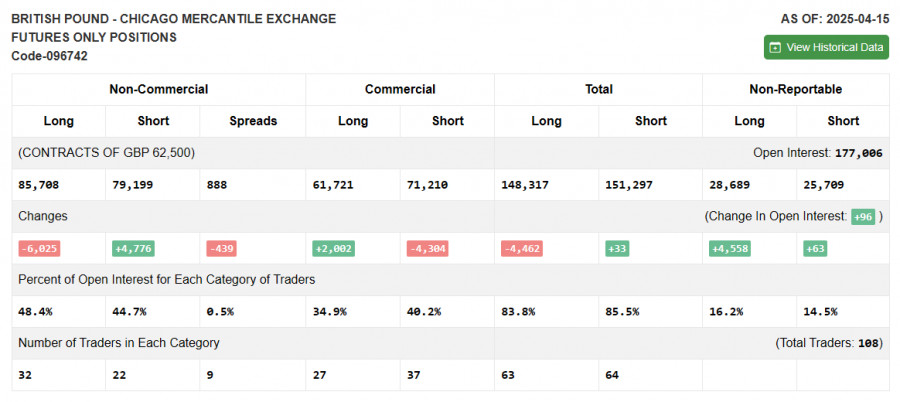
The COT (Commitment of Traders) report for April 15 showed an increase in short positions and a decline in long positions. Interestingly, even against this backdrop, the pound continued to strengthen against the dollar. It's important to understand that this data is lagging, and the recent strong rally in GBP/USD is largely tied to Trump's stance on tariffs and dissatisfaction with Fed Chair Jerome Powell—factors that pressure the dollar more than support the pound.
According to the latest COT report, long non-commercial positions fell by 6,025 to 85,708 and short non-commercial positions rose by 4,776 to 79,199. The gap between long and short positions narrowed by 439.Indicator Signals:
Moving Averages Trading is taking place near the 30- and 50-day moving averages, indicating market indecision.
Note: The author evaluates moving averages based on the hourly (H1) chart, which may differ from the standard daily (D1) chart analysis.
Bollinger Bands In the event of a decline, the lower boundary of the indicator around 1.3270 will act as support.
Indicator Definitions:
You have already liked this post today
*The market analysis posted here is meant to increase your awareness, but not to give instructions to make a trade.
In my morning forecast, I highlighted the 1.1337 level and planned to make market entry decisions based on it. Let's look at the 5-minute chart and analyze what happened there
Several entry points into the market were formed yesterday. Let's look at the 5-minute chart and break down what happened. I highlighted the 1.3282 level in my morning forecast
Yesterday, several entry points into the market were formed. Let's look at the 5-minute chart and analyze what happened. In my morning forecast, I highlighted the 1.1320 level
Analysis of Thursday's Trades 1H Chart of GBP/USD On Thursday, the GBP/USD pair continued its downward movement, although the overall picture still closely resembles a sideways range. The British pound
Analysis of Thursday's Trades 1H Chart of EUR/USD On Thursday, the EUR/USD currency pair continued its downward movement and reached the 1.1275 level by the end of the day, which
The GBP/USD currency pair continued to correct downward following Monday's rally and against the broader uptrend. There was no reason to expect the kind of price action that ultimately unfolded
The EUR/USD currency pair continued its mild upward movement on Thursday. The ongoing rise of the U.S. dollar looks strange, but strange price behavior has become the norm in recent
Forex Chart
Web-version

Your IP address shows that you are currently located in the USA. If you are a resident of the United States, you are prohibited from using the services of InstaFintech Group including online trading, online transfers, deposit/withdrawal of funds, etc.
If you think you are seeing this message by mistake and your location is not the US, kindly proceed to the website. Otherwise, you must leave the website in order to comply with government restrictions.
Why does your IP address show your location as the USA?
Please confirm whether you are a US resident or not by clicking the relevant button below. If you choose the wrong option, being a US resident, you will not be able to open an account with InstaTrade anyway.
We are sorry for any inconvenience caused by this message.


