See also


 24.03.2025 07:08 AM
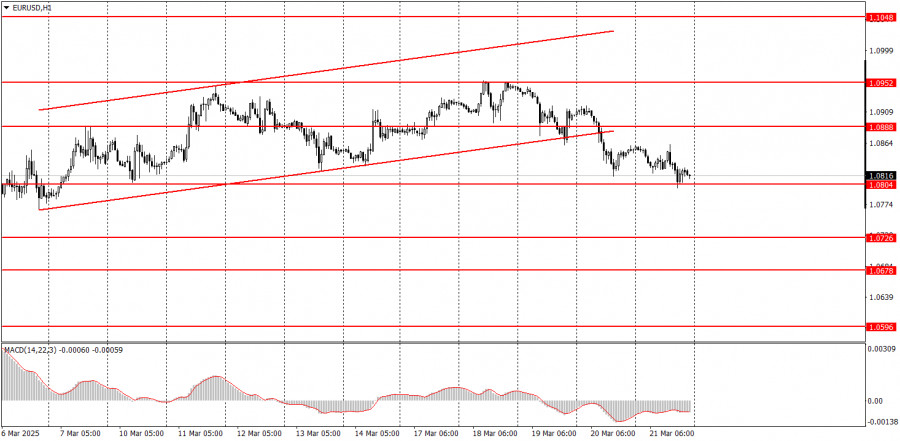
The EUR/USD currency pair continued a sluggish downward movement on Friday. A few days earlier, the price had broken below the ascending channel, so a decline in the euro was to be expected. There were no significant events in the Eurozone or the U.S. on Friday, which explains the low volatility. However, it's worth noting that the pair has generally shown low volatility in recent weeks. The market has "digested" Donald Trump's tariff headlines and is no longer mindlessly selling the dollar. On Wednesday evening, Jerome Powell stated that there are no problems with the U.S. economy. This somewhat calmed the market, and the Fed maintained its previous hawkish stance, which implies no more than two rate cuts in 2025. While the U.S. economy may slow due to trade wars, the same applies to the UK and the EU. Essentially, we saw an emotional sell-off of the dollar, not backed by concrete fundamental or macroeconomic drivers. A correction is now overdue.
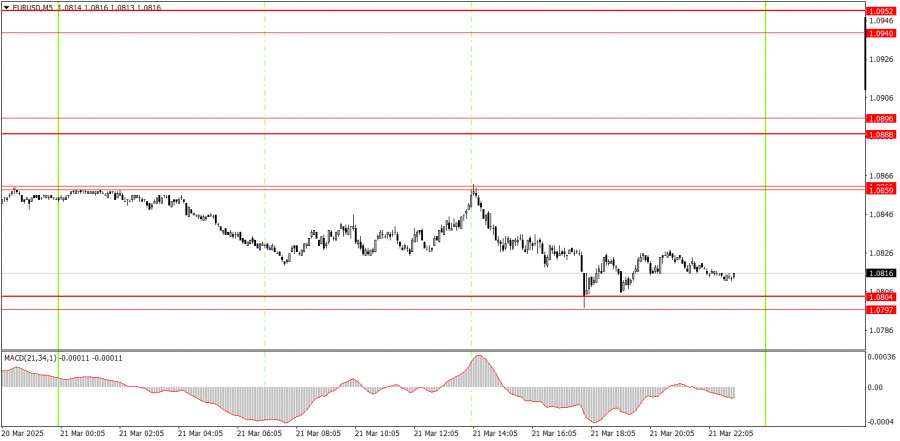
On the 5-minute timeframe, several signals were formed on Friday, but intraday movements were weak. The 1.0845–1.0851 zone has been shifted to 1.0859–1.0861. In the previous version of this area, buy and sell signals were triggered on Friday. The buy signal was false, while the sell signal was profitable, as the nearest target was reached. As a result, novice traders couldn't incur a loss on Friday, but profiting from such weak moves was also quite difficult.
In the hourly timeframe, EUR/USD remains in a medium-term downtrend, but the chances of its continuing are diminishing. Since the fundamental and macroeconomic background continues to favor the U.S. dollar much more than the euro, we still expect further decline. However, Donald Trump keeps pulling the dollar down with his constant tariff decisions and vision for U.S. global dominance. Fundamentals and macroeconomics remain overshadowed by politics and geopolitics, so a strong dollar rally is not expected for now.
On Monday, the euro may continue to fall, as for the first time in a while, the market reacted to fundamentals correctly (the Fed meeting), and technically, the pair has broken below the ascending channel. The dollar has been oversold and undervalued too sharply and without sufficient justification. A correction is likely.
On the 5-minute chart, watch the following levels: 1.0433–1.0451, 1.0526, 1.0596, 1.0678, 1.0726–1.0733, 1.0797–1.0804, 1.0859–1.0861, 1.0888–1.0896, 1.0940–1.0952, 1.1011, 1.1048. On Monday, preliminary March PMI data for the services and manufacturing sectors will be published in Germany, the Eurozone, and the U.S. These are moderately important reports, but they may provoke a market reaction.
Support and Resistance Levels: These are target levels for opening or closing positions and can also serve as points for placing Take Profit orders.
Red Lines: Channels or trendlines indicating the current trend and the preferred direction for trading.
MACD Indicator (14,22,3): A histogram and signal line used as a supplementary source of trading signals.
Important Events and Reports: Found in the economic calendar, these can heavily influence price movements. Exercise caution or exit the market during their release to avoid sharp reversals.
Forex trading beginners should remember that not every trade will be profitable. Developing a clear strategy and practicing proper money management are essential for long-term trading success.
You have already liked this post today
*The market analysis posted here is meant to increase your awareness, but not to give instructions to make a trade.
In my morning forecast, I highlighted the 1.1337 level and planned to make market entry decisions based on it. Let's look at the 5-minute chart and analyze what happened there
Several entry points into the market were formed yesterday. Let's look at the 5-minute chart and break down what happened. I highlighted the 1.3282 level in my morning forecast
Yesterday, several entry points into the market were formed. Let's look at the 5-minute chart and analyze what happened. In my morning forecast, I highlighted the 1.1320 level
Analysis of Thursday's Trades 1H Chart of GBP/USD On Thursday, the GBP/USD pair continued its downward movement, although the overall picture still closely resembles a sideways range. The British pound
Analysis of Thursday's Trades 1H Chart of EUR/USD On Thursday, the EUR/USD currency pair continued its downward movement and reached the 1.1275 level by the end of the day, which
The GBP/USD currency pair continued to correct downward following Monday's rally and against the broader uptrend. There was no reason to expect the kind of price action that ultimately unfolded
The EUR/USD currency pair continued its mild upward movement on Thursday. The ongoing rise of the U.S. dollar looks strange, but strange price behavior has become the norm in recent
InstaTrade video
analytics
Daily analytical reviews
InstaTrade in figures

Your IP address shows that you are currently located in the USA. If you are a resident of the United States, you are prohibited from using the services of InstaFintech Group including online trading, online transfers, deposit/withdrawal of funds, etc.
If you think you are seeing this message by mistake and your location is not the US, kindly proceed to the website. Otherwise, you must leave the website in order to comply with government restrictions.
Why does your IP address show your location as the USA?
Please confirm whether you are a US resident or not by clicking the relevant button below. If you choose the wrong option, being a US resident, you will not be able to open an account with InstaTrade anyway.
We are sorry for any inconvenience caused by this message.


