empty
18.03.2025 07:30 PM
GBP/USD: Trading Plan for the U.S. Session on March 18th (Analysis of Morning Trades)

In my morning forecast, I focused on the 1.2994 level and planned to make market entry decisions based on it. Let's look at the 5-minute chart and analyze what happened. A rise and a false breakout around 1.2994 provided a good entry point for selling the pound. However, as seen on the chart, there was no significant decline. The technical outlook for the second half of the day has been revised.

This image is no longer relevant

For Opening Long Positions on GBP/USD:

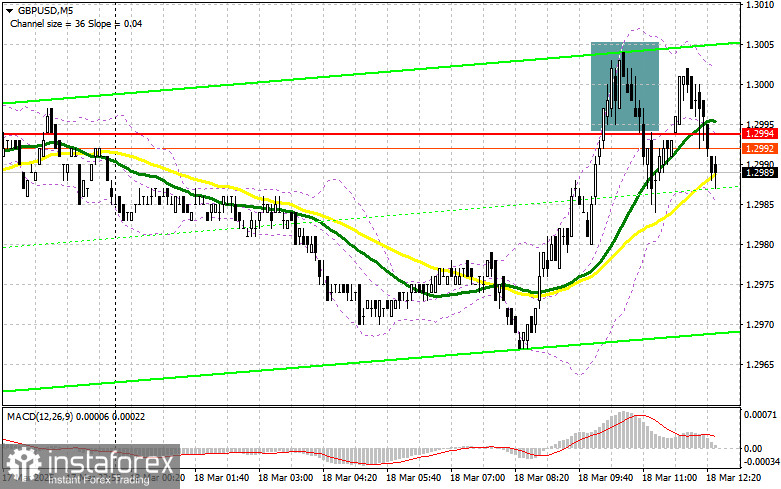
The pound continued its growth due to the lack of any economic data from the UK, just as it had throughout the previous week. Today was no exception. However, after updating the weekly high, buyers slowed down, signaling caution ahead of tomorrow's Federal Reserve meeting and the Bank of England meeting on Thursday.

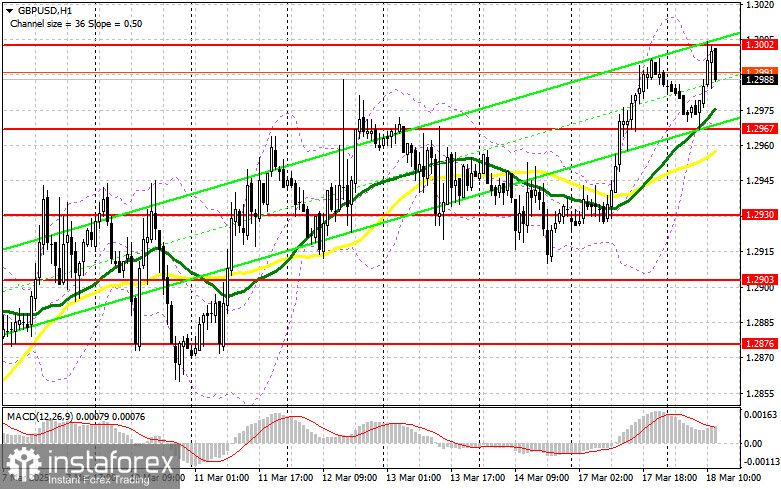
During the U.S. session, housing market data, including building permits, housing starts, and industrial production changes, will be released. Only very strong figures can pressure the pound. Given the bullish trend, the best strategy is to buy on corrections from the nearest support at 1.2967, which formed during the first half of the day. A false breakout at this level will provide a good entry point for long positions, aiming for a recovery towards 1.3002 (weekly high). A break and retest of this level from above will confirm the validity of long positions, targeting 1.3035, strengthening the bullish market. The final target will be 1.3068, where I plan to take profits.

If GBP/USD declines and lacks bullish activity around 1.2967, pressure on the pound will increase, though it is unlikely to significantly impact bullish prospects. In this case, a false breakout at 1.2930 would be a suitable condition for opening long positions. If the price falls further, I will buy GBP/USD from support at 1.2903, expecting a 30-35 point intraday rebound.

For Opening Short Positions on GBP/USD:

Sellers are attempting to act, but there are no strong drivers for active selling yet. In the second half of the day, the focus will shift to defending resistance at 1.3002, which will likely be tested if U.S. data disappoints. A false breakout at this level will provide a selling opportunity, aiming for a drop to 1.2967, where the moving averages currently favor bulls.

A break and retest of 1.2967 from below will trigger stop-loss orders, opening the way to 1.2930, marking a significant correction. The final target will be 1.2903, where I will take profits. Testing this level could halt the bullish trend.

If demand for the pound remains strong in the second half of the day, and bears fail to defend 1.3002, I will delay selling until a test of 1.3035, entering short positions only after a failed consolidation. If GBP/USD fails to move lower from there, I will look for short positions from 1.3068, targeting a 30-35 point pullback.

This image is no longer relevant

Commitments of Traders (COT) Report:

The COT report from March 11 showed an increase in both long and short positions, but long positions increased significantly more, strengthening the bullish advantage for the pound. This is also reflected in the GBP/USD chart.

Given the positive trends in the UK economy and the Bank of England's gradual approach to rate cuts, GBP/USD is likely to continue its growth. The upcoming Federal Reserve meeting could weaken the U.S. dollar further, meaning pound buyers have little to worry about. However, corrections remain possible before updating local highs.

The COT report showed that long non-commercial positions increased by 12,920 to 94,786, while short non-commercial positions added only 2,301, reaching 65,593. As a result, the gap between long and short positions expanded by 10,925 in favor of buyers.

This image is no longer relevant

Indicator Signals:

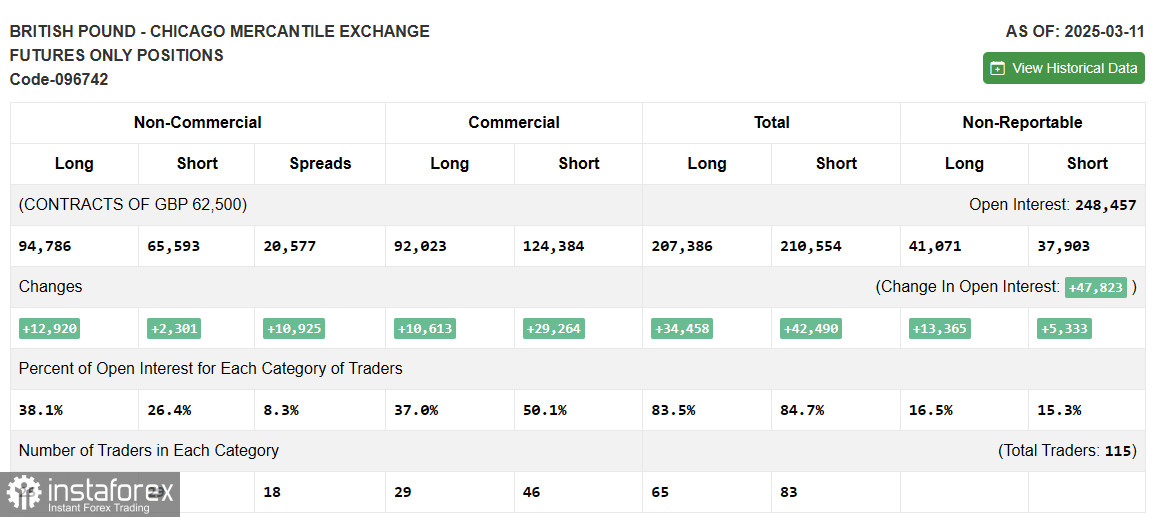
Moving Averages: The pair is trading above the 30 and 50-period moving averages, indicating further upward potential for GBP/USD.

Bollinger Bands: If the pair declines, support will be found at the lower boundary of the indicator at 1.2967.

Indicator Descriptions:

  • Moving Average (MA): Determines the current trend by smoothing volatility and noise.
  • MACD (Moving Average Convergence/Divergence): Measures trend strength and potential reversals.
  • Bollinger Bands: Used to identify overbought and oversold market conditions.
  • Non-commercial traders: Speculators such as hedge funds and large institutions who trade futures for speculative purposes.
  • Long non-commercial positions: The total long open interest of non-commercial traders.
  • Short non-commercial positions: The total short open interest of non-commercial traders.
  • Net non-commercial position: The difference between short and long positions of non-commercial traders.
Miroslaw Bawulski,
Analytical expert of InstaTrade
© 2007-2025

Recommended Stories

GBP/USD: Trading Plan for the U.S. Session on May 2nd (Review of Morning Trades)

In my morning forecast, I focused on the 1.3313 level and planned to make trading decisions from there. Let's take a look at the 5-minute chart and break down what

Miroslaw Bawulski 12:14 2025-05-02 UTC+2

EUR/USD: Trading Plan for the U.S. Session on May 2nd (Review of the Morning Trades)

In my morning forecast, I highlighted the 1.1337 level and planned to make market entry decisions based on it. Let's look at the 5-minute chart and analyze what happened there

Miroslaw Bawulski 12:06 2025-05-02 UTC+2

GBP/USD: Trading Plan for the European Session on May 2. Commitment of Traders (COT) Reports (Trade Review). The Pound in a Difficult Position

Several entry points into the market were formed yesterday. Let's look at the 5-minute chart and break down what happened. I highlighted the 1.3282 level in my morning forecast

Miroslaw Bawulski 07:53 2025-05-02 UTC+2

EUR/USD: Trading Plan for the European Session on May 2. Commitment of Traders (COT) Reports (Trade Review). The Dollar Reacts to Any Positive Data

Yesterday, several entry points into the market were formed. Let's look at the 5-minute chart and analyze what happened. In my morning forecast, I highlighted the 1.1320 level

Miroslaw Bawulski 07:53 2025-05-02 UTC+2

How to Trade the GBP/USD Pair on May 2? Simple Tips and Trade Analysis for Beginners

Analysis of Thursday's Trades 1H Chart of GBP/USD On Thursday, the GBP/USD pair continued its downward movement, although the overall picture still closely resembles a sideways range. The British pound

Paolo Greco 06:31 2025-05-02 UTC+2

How to Trade the EUR/USD Pair on May 2? Simple Tips and Trade Analysis for Beginners

Analysis of Thursday's Trades 1H Chart of EUR/USD On Thursday, the EUR/USD currency pair continued its downward movement and reached the 1.1275 level by the end of the day, which

Paolo Greco 06:31 2025-05-02 UTC+2

Trading Recommendations and Analysis for GBP/USD on May 2: The Dollar Faces a Tough Test

The GBP/USD currency pair continued to correct downward following Monday's rally and against the broader uptrend. There was no reason to expect the kind of price action that ultimately unfolded

Paolo Greco 03:47 2025-05-02 UTC+2

Trading Recommendations and Analysis for EUR/USD on May 2: Third Consecutive Day of Dollar Strength

The EUR/USD currency pair continued its mild upward movement on Thursday. The ongoing rise of the U.S. dollar looks strange, but strange price behavior has become the norm in recent

Paolo Greco 03:47 2025-05-02 UTC+2

GBP/USD: Trading Plan for the U.S. Session on May 1st (Review of the Morning Trades)

In my morning forecast, I focused on the 1.3282 level and planned to make entry decisions based on it. Let's take a look at the 5-minute chart and see what

Miroslaw Bawulski 18:42 2025-05-01 UTC+2

EUR/USD: Trading Plan for the U.S. Session on May 1st (Review of the Morning Trades)

In my morning forecast, I focused on the 1.1320 level and planned to make market entry decisions based on it. Let's take a look at the 5-minute chart

Miroslaw Bawulski 18:38 2025-05-01 UTC+2
Can't speak right now?
Ask your question in the chat.
 

Dear visitor,

Your IP address shows that you are currently located in the USA. If you are a resident of the United States, you are prohibited from using the services of InstaFintech Group including online trading, online transfers, deposit/withdrawal of funds, etc.

If you think you are seeing this message by mistake and your location is not the US, kindly proceed to the website. Otherwise, you must leave the website in order to comply with government restrictions.

Why does your IP address show your location as the USA?

  • - you are using a VPN provided by a hosting company based in the United States;
  • - your IP does not have proper WHOIS records;
  • - an error occurred in the WHOIS geolocation database.

Please confirm whether you are a US resident or not by clicking the relevant button below. If you choose the wrong option, being a US resident, you will not be able to open an account with InstaTrade anyway.

We are sorry for any inconvenience caused by this message.