See also


 18.03.2025 03:35 AM
On Monday, the GBP/USD currency pair again showed an upward movement despite having no reason. The market continues to buy the British pound purely out of inertia, much like Bitcoin. Bitcoin often rises simply because everyone is buying it, hoping it will be worth millions. The same logic applies to the pound—the exchange rate rises, so traders keep buying, which fuels further growth. There were no significant events in the UK on Monday, and the only report from the U.S. supported the dollar. However, even a minimal strengthening of the U.S. currency did not occur. Donald Trump did not introduce new tariffs or sanctions that day, but that did not help. After a short pause, the British currency resumed its growth as if nothing had happened. Looking for logic in the current movements is pointless.
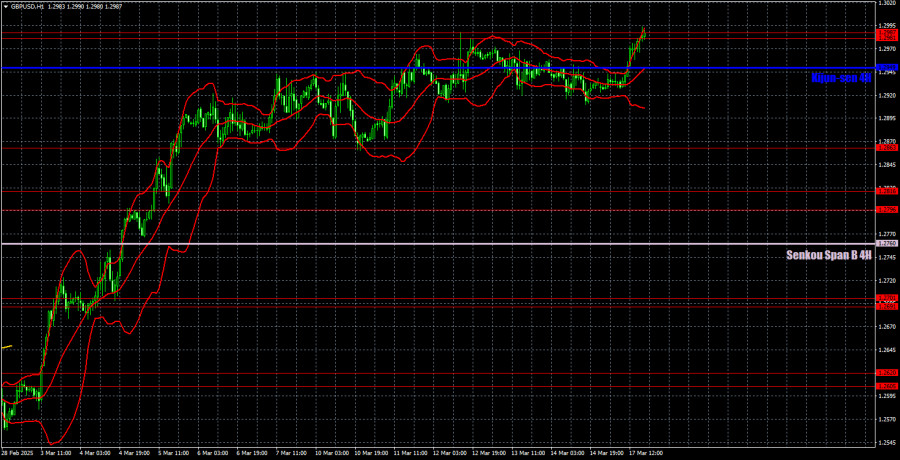
From a technical standpoint, on the hourly timeframe, one uptrend is replaced by another uptrend. It sounds paradoxical, but that's the reality. There are no corrections, not even minimal ones. The pound rises on days when there are fundamental reasons for it and on days when there are none. It's a one-sided movement.
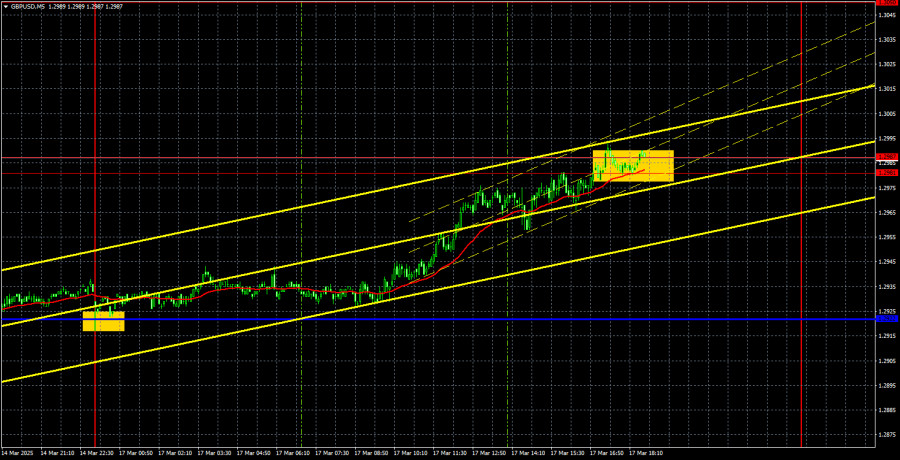
Despite the lack of logic in Monday's movements, there were still good profit opportunities. The only trading signal of the day formed right at the market opening at night when the price rebounded from the critical line. However, when the European session began, the price was already very close to the Kijun-sen line, meaning traders could have entered long positions slightly later. By evening, the pound was trading in the 1.2981-1.2987 area, where profits from long positions could have been secured. The pound's growth may well continue even higher.
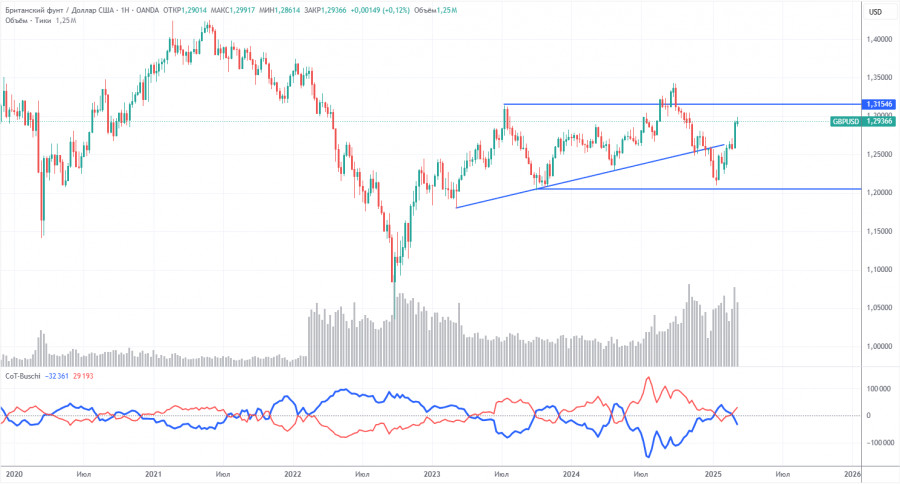
COT reports on the British pound indicate that sentiment among commercial traders has been fluctuating over recent years. The red and blue lines, which represent the net positions of commercial and non-commercial traders, frequently intersect and typically hover around the zero mark. Currently, they are close to each other, suggesting a roughly equal number of buy and sell positions.
On the weekly timeframe, the price initially broke through the 1.3154 level before dropping to the trend line, which it subsequently breached. This break suggests that the pound is likely to continue its decline. However, there was also a rebound from the second-to-last local low on the weekly chart, indicating that the market might be entering a period of sideways movement.
According to the latest report on the British pound, the non-commercial group opened 12,900 BUY contracts and 2,300 SELL contracts. Consequently, the net position of non-commercial traders increased by 10,600 contracts over the week.
The fundamental background still does not provide justification for long-term purchases of the British pound. The currency may continue its global downward trend. While the pound has risen significantly in recent times, this increase can be attributed largely to Donald Trump's policies.
On the hourly timeframe, the GBP/USD pair maintains an uptrend, having spent several days in a flat movement before now targeting a resumption of growth. A correction on the daily timeframe is long overdue. We still do not see any justification for the pound's growth in the long term. The only factor supporting the British currency is Donald Trump, who imposes sanctions and tariffs indiscriminately. And even when no new sanctions are introduced, the dollar still falls. The market is ignoring all other factors.
For March 18, we highlight the following key levels: 1.2237-1.2255, 1.2331-1.2349, 1.2429-1.2445, 1.2511, 1.2605-1.2620, 1.2691-1.2701, 1.2796-1.2816, 1.2863, 1.2981-1.2987, 1.3050. The Senkou Span B (1.2760) and Kijun-sen (1.2949) lines may also serve as sources of trading signals. Setting a Stop Loss at breakeven is recommended once the price moves 20 pips in the right direction. The Ichimoku indicator lines may shift throughout the day, which should be considered when determining trade signals.
On Tuesday, no significant events are scheduled in the UK, while in the U.S., the most important release will be the industrial production report. Regardless of its outcome, it is unlikely to strengthen the U.S. dollar as the market continues to ignore all news supporting the U.S. currency.
You have already liked this post today
*The market analysis posted here is meant to increase your awareness, but not to give instructions to make a trade.
Yesterday, several entry points into the market were formed. Let's take a look at the 5-minute chart and analyze what happened. In my morning forecast, I highlighted the level
Yesterday, several suitable entry points into the market were formed. Let's take a look at the 5-minute chart and analyze what happened. In my morning forecast, I highlighted the level
The GBP/USD pair traded higher on Thursday, but with extremely low volatility. Despite the release of two crucial reports on the U.S. labor market and unemployment, neither report sparked volatility
The GBP/USD currency pair initially rose, only to decline on Thursday. Yesterday, reports were released in the U.S. that the market had eagerly anticipated, although we warned in previous articles
The EUR/USD currency pair traded in a super-volatile manner on Thursday. The volatility was an "unreal" 47 pips. This occurred on a day when reports on U.S. Non-Farm Payrolls
The GBP/USD pair also moved lower on Wednesday. It should be acknowledged that the British pound had reasons for its new decline, as it has been continuously bombarded with negative
The EUR/USD currency pair plummeted in the second half of Thursday, dropping sharply. The first question that comes to mind is: why? Let's take a look at the economic calendar
InstaTrade
PAMM accounts

Your IP address shows that you are currently located in the USA. If you are a resident of the United States, you are prohibited from using the services of InstaFintech Group including online trading, online transfers, deposit/withdrawal of funds, etc.
If you think you are seeing this message by mistake and your location is not the US, kindly proceed to the website. Otherwise, you must leave the website in order to comply with government restrictions.
Why does your IP address show your location as the USA?
Please confirm whether you are a US resident or not by clicking the relevant button below. If you choose the wrong option, being a US resident, you will not be able to open an account with InstaTrade anyway.
We are sorry for any inconvenience caused by this message.


