empty
17.03.2025 06:17 PM
EUR/USD: Trading Plan for the U.S. Session on March 17th (Review of Morning Trades)

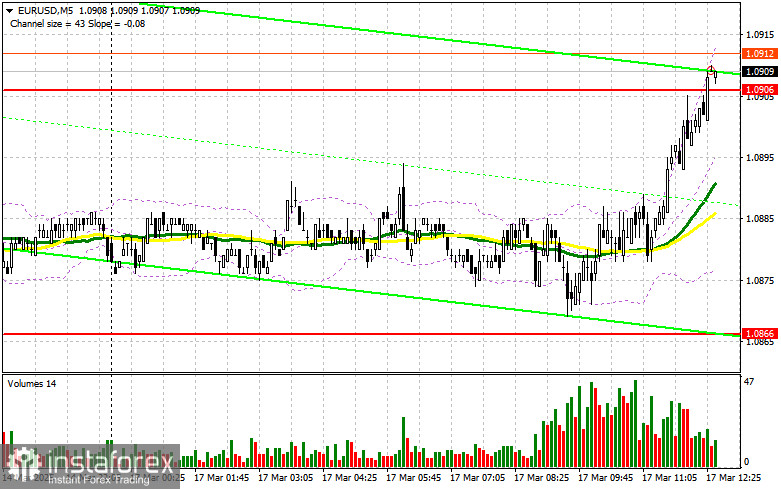
In my morning forecast, I highlighted the 1.0866 level as a key point for making entry decisions. Let's look at the 5-minute chart to analyze what happened. A decline did occur, but the price fell just short of testing the level by a couple of points, leaving me without a suitable entry point. The technical outlook for the second half of the day remains unchanged.

This image is no longer relevant

To Open Long Positions on EUR/USD:

The absence of economic data from the Eurozone allowed euro buyers to show some activity, but as seen on the chart, the pair failed to generate strong upward momentum. However, the bullish outlook still appears more promising than a corrective decline.

Key upcoming reports include U.S. retail sales, as well as the Empire Manufacturing Index and the NAHB Housing Market Index. If retail sales rise, demand for the dollar will return, as stronger spending could increase inflationary pressure. Given the lackluster market conditions, I prefer to buy the pair on a decline.

The primary goal for bulls in the second half of the day is to defend the 1.0866 support level. A false breakout at this level would be a buy signal, reinforcing the bullish market structure with a target of 1.0906. A break and a subsequent retest of this level would confirm a valid buy entry, leading to 1.0945, the upper boundary of the sideways channel. The final target would be the 1.0997 high, where I will lock in profits.

If EUR/USD declines and buyers fail to show activity at 1.0866, the pair will likely remain within the range, possibly leading to a minor correction. Sellers could push the pair down to 1.0827. Only after a false breakout at this level would I consider buying the euro. If the pair drops further, I will buy on a rebound from 1.0770, aiming for a 30-35 point intraday correction.

To Open Short Positions on EUR/USD:

Sellers have been inactive, and their return to the market depends on strong U.S. retail sales data. A false breakout at 1.0906, combined with positive economic reports, would provide an entry point for short positions, aiming for a correction toward 1.0866, where the 50-day and 30-day moving averages (favoring bulls) are located.

A break and consolidation below this range would offer an additional selling opportunity, targeting 1.0827. The final bearish target is 1.0770, where I will take profits.

If EUR/USD rises in the second half of the day and bears fail to act at 1.0906, buyers may push the pair significantly higher. In that case, I will delay short positions until the next resistance level at 1.0945, where I will sell only after an unsuccessful breakout attempt. I will sell immediately on a rebound from 1.0997, targeting a 30-35 point downward correction.

This image is no longer relevant

COT (Commitments of Traders) Report – March 4:

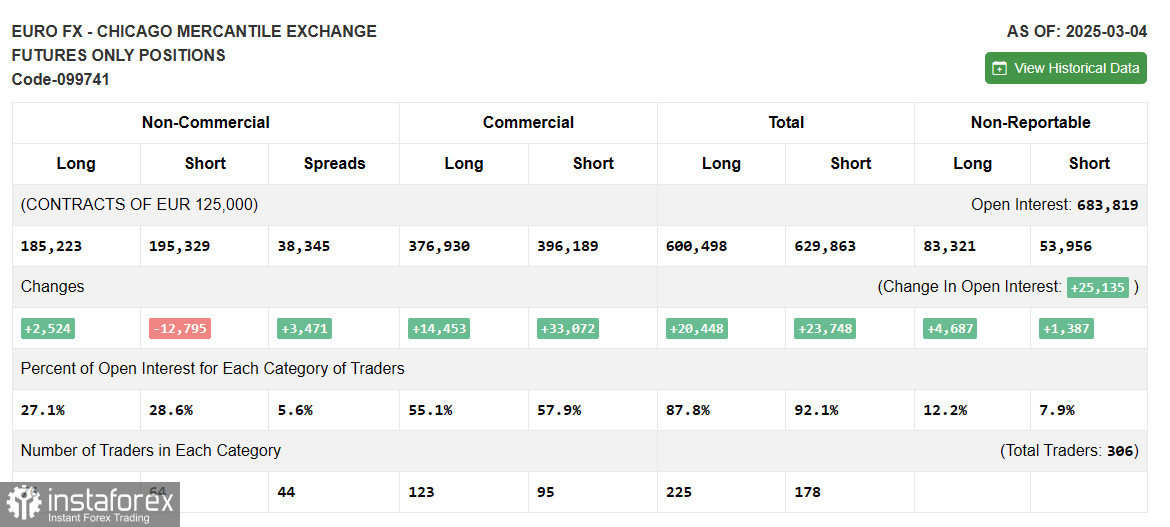
The latest COT report showed a rise in long positions and a significant reduction in short positions, indicating that more traders are willing to buy the euro. Germany's new fiscal stimulus measures have boosted demand for the euro, leading to its strengthening against the U.S. dollar.

The ECB's cautious stance on rate cuts has also supported EUR/USD demand, as reflected in the COT report. The small advantage held by euro sellers is no longer as significant, but buying at current highs still requires caution.

According to the COT data, non-commercial long positions increased by 2,524 to 185,223, while short positions dropped by 12,795 to 195,329. As a result, the gap between long and short positions widened by 3,471.

This image is no longer relevant

Indicator Signals:

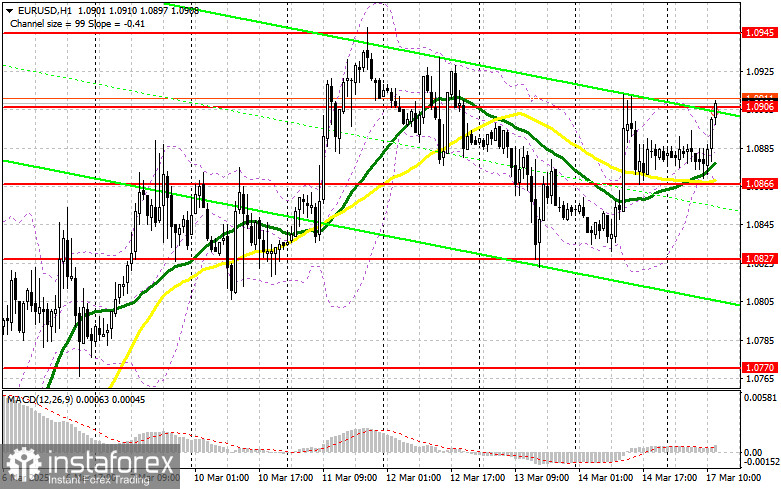
Moving Averages: Trading is currently taking place near the 30-day and 50-day moving averages, indicating market uncertainty.

Bollinger Bands: If the price declines, the lower Bollinger Band near 1.0866 will act as support.

Indicator Descriptions:

  • Moving Average (MA) – Smooths volatility and noise to define the current trend.
    • 50-period MA (yellow line)
    • 30-period MA (green line)
  • MACD (Moving Average Convergence/Divergence)
    • Fast EMA – 12-period
    • Slow EMA – 26-period
    • SMA – 9-period
  • Bollinger Bands – Measures volatility. 20-period setting used.
  • Non-commercial traders – Speculators such as individual traders, hedge funds, and institutions using the futures market for speculation.
  • Non-commercial long positions – The total number of long contracts held by non-commercial traders.
  • Non-commercial short positions – The total number of short contracts held by non-commercial traders.
  • Net non-commercial position – The difference between short and long positions among non-commercial traders.
Miroslaw Bawulski,
Analytical expert of InstaTrade
© 2007-2025

Recommended Stories

How to Trade the GBP/USD Pair on June 3? Simple Tips and Trade Analysis for Beginners

Analysis of Monday's Trades 1H Chart of GBP/USD The GBP/USD pair also traded higher throughout Monday. However, the overall technical picture of the British pound differs slightly from that

Paolo Greco 06:27 2025-06-03 UTC+2

How to Trade the EUR/USD Pair on June 3? Simple Tips and Trade Analysis for Beginners

Analysis of Monday's Trades 1H Chart of EUR/USD The EUR/USD currency pair traded higher on Monday. We had warned that the dollar would likely decline again after Trump announced increased

Paolo Greco 06:27 2025-06-03 UTC+2

Trading Recommendations and Analysis for EUR/USD on June 3: Trump and ISM Hammer the Dollar

The EUR/USD currency pair showed fairly strong upward movement on Monday. Just as expected, the U.S. dollar started falling right from the market's opening on Monday night. What else could

Paolo Greco 03:57 2025-06-03 UTC+2

Trading Recommendations and Analysis for GBP/USD on June 3: The Pound Seized Another

As we had warned, the GBP/USD currency pair also traded strongly on Monday. The U.S. dollar got off lightly, as the fall could have been much sharper. Traders witnessed

Paolo Greco 03:57 2025-06-03 UTC+2

GBP/USD: Trading Plan for the U.S. Session on June 2nd (Review of Morning Trades)

In my morning forecast, I focused on the 1.3555 level and planned to base market entry decisions around it. Let's look at the 5-minute chart and analyze what happened

Miroslaw Bawulski 18:50 2025-06-02 UTC+2

EUR/USD: Trading Plan for the U.S. Session on June 2nd (Review of Morning Trades)

In my morning forecast, I focused on the 1.1416 level and planned to base market entry decisions around it. Let's look at the 5-minute chart and analyze what happened

Miroslaw Bawulski 18:47 2025-06-02 UTC+2

How to Trade the GBP/USD Pair on June 2? Simple Tips and Trade Analysis for Beginners

Analysis of Friday's Trades 1H Chart of GBP/USD The GBP/USD pair also traded quite calmly throughout Friday. There were no important news or events that day, so the volatility

Paolo Greco 06:08 2025-06-02 UTC+2

How to Trade the EUR/USD Pair on June 2? Simple Tips and Trade Analysis for Beginners

Analysis of Friday's Trades 1H Chart of EUR/USD The EUR/USD currency pair traded more calmly on Friday than on Thursday. This is not surprising, as the macroeconomic background was weak

Paolo Greco 06:08 2025-06-02 UTC+2

Trading Recommendations and Analysis for GBP/USD on June 2: The Pound Was Just Preparing for a Correction

On Friday, the GBP/USD currency pair tried again to resume its mild downward movement, as the price had previously exited the ascending channel. Thus, from a technical point of view

Paolo Greco 03:55 2025-06-02 UTC+2

Trading Recommendations and Analysis for EUR/USD on June 2: A New Storm is Near...

The EUR/USD currency pair traded very calmly on Friday, with no news of market-moving scale. In recent months, traders have paid little attention to routine macroeconomic data. Almost every week

Paolo Greco 03:55 2025-06-02 UTC+2
Can't speak right now?
Ask your question in the chat.
 

Dear visitor,

Your IP address shows that you are currently located in the USA. If you are a resident of the United States, you are prohibited from using the services of InstaFintech Group including online trading, online transfers, deposit/withdrawal of funds, etc.

If you think you are seeing this message by mistake and your location is not the US, kindly proceed to the website. Otherwise, you must leave the website in order to comply with government restrictions.

Why does your IP address show your location as the USA?

  • - you are using a VPN provided by a hosting company based in the United States;
  • - your IP does not have proper WHOIS records;
  • - an error occurred in the WHOIS geolocation database.

Please confirm whether you are a US resident or not by clicking the relevant button below. If you choose the wrong option, being a US resident, you will not be able to open an account with InstaTrade anyway.

We are sorry for any inconvenience caused by this message.