See also


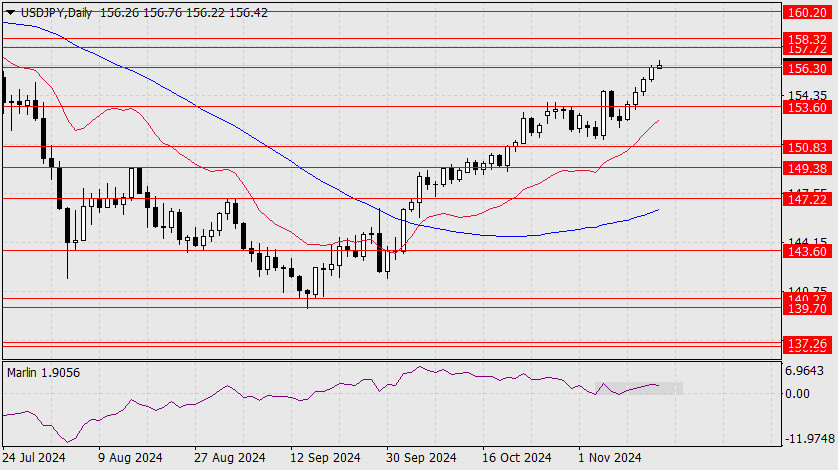
The USD/JPY pair has reached the target level of 156.30. Over the past eight days, the price has advanced by 5.5 figures, yet the Marlin oscillator on the daily timeframe remains within a range marked by a gray rectangle.
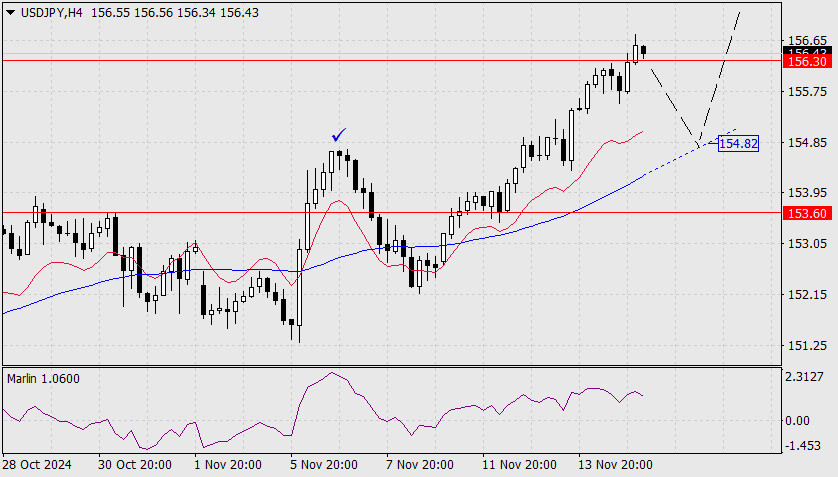
This situation suggests that a deep correction (potentially 153.60) could begin from the target range of 157.72–158.32. However, if the price breaks above the upper boundary of the range at 158.32 and the Marlin oscillator exits its current range, the growth could continue toward the 160.20 target. The four-hour chart indicates a potential for a correction from the current levels.
For this to materialize, the price must consolidate below the 156.30 level. A corrective decline to the MACD line near 154.82 is possible, aligning closely with the peak level of November 7 (marked as a checkmark). The Marlin oscillator on the H4 timeframe shows signs of a potential downward reversal.
You have already liked this post today
*The market analysis posted here is meant to increase your awareness, but not to give instructions to make a trade.


