See also


 04.11.2024 06:51 AM
GOLD
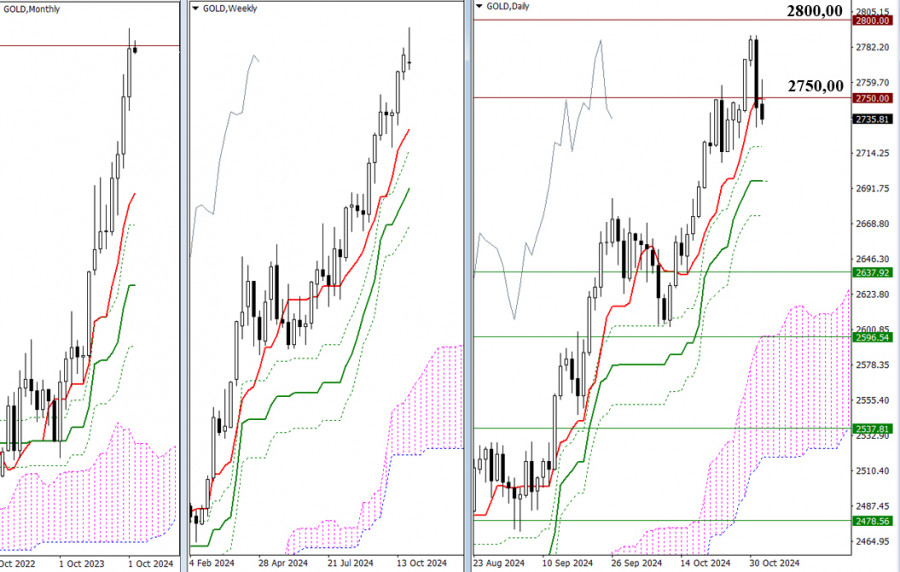
On Friday, the weekly result was marked by an uncertainty candle with an extended upper shadow. It is possible that the bears found a good spot for a corrective decline, as the bulls failed to reach 2800.00 and closed October below the psychological level of 2750.00, which had been actively tested throughout the second half of the month. It should be noted that the bears secured support from the daily short-term trend (2748.92), which is now defending their interests. If a decline develops, the primary task for the bears at this section of the chart will be to test, break, and eliminate the daily golden cross, which currently can be marked at levels 2718.28 – 2696.24 – 2674.21.
For the bulls, the nearest prospects maintain their relevance and position. New bullish opportunities may arise only after the 2750.00 level is broken and the resistance zone 2800.00 is tested and overcome.
H4 – H1
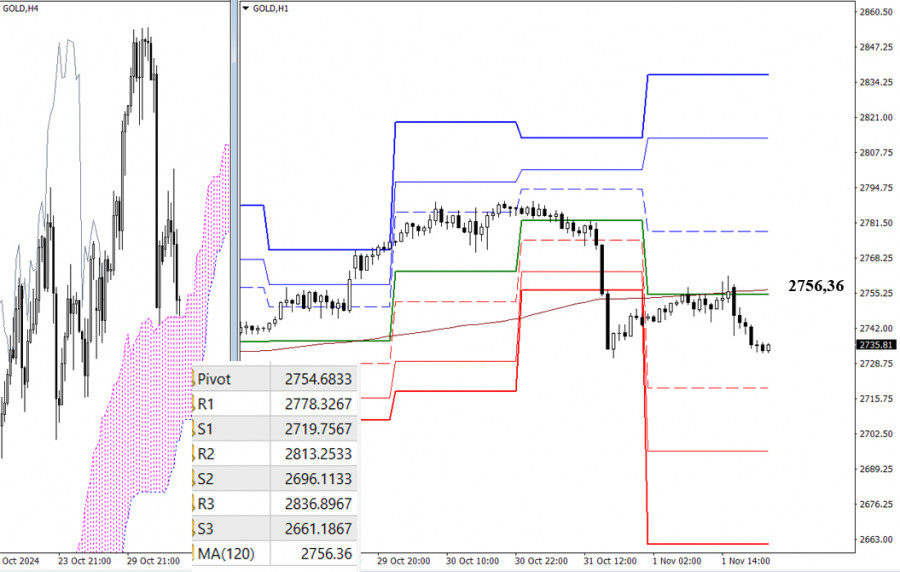
On the lower time frames, the pair tested the weekly long-term trend (2756.36) from below on Friday, with the bears managing to defend their advantage and remain below the trend. Soon, it will be necessary for the bears to break through the H4 cloud, exit, and secure a position in the bearish zone relative to the cloud. If the cloud break is realized, additional downward targets on the lower timeframes, including the supports of the classic Pivot levels, will be added with the newly formed target for the H4 cloud breakout. If the bulls use the cloud's support and push off from it, simultaneously gaining the weekly long-term trend, then the intraday market focus will shift to the resistances of the classic Pivot levels. On the higher time frames, bulls will again aim to conquer 2750.00 and reach 2800.00.
Updated classic Pivot level values for guidance will appear when trading opens at the start of the new workweek.
Technical Analysis Components:
You have already liked this post today
*The market analysis posted here is meant to increase your awareness, but not to give instructions to make a trade.
Useful links: My other articles are available in this section InstaForex course for beginners Popular Analytics Open trading account Important: The begginers in forex trading need to be very careful
From what we see on the 4-hour chart of the Nasdaq 100 index, there are several interesting things, namely, first, the price movement is moving below the MA (100), second
Early in the American session, gold is trading around 3,312 with a bullish bias after breaking out of the symmetrical triangle. Gold is now likely to continue rising
Useful links: My other articles are available in this section InstaForex course for beginners Popular Analytics Open trading account Important: The begginers in forex trading need to be very careful
On the 4-hour chart, the USD/CAD commodity currency pair can be seen moving below the EMA (100) and the appearance of a Bearish 123 pattern and the position
With the Stochastic Oscillator condition heading towards the Oversold level (20) on the 4-hour chart of the AUD/JPY cross currency pair, in the near future AUD/JPY has the potential

Your IP address shows that you are currently located in the USA. If you are a resident of the United States, you are prohibited from using the services of InstaFintech Group including online trading, online transfers, deposit/withdrawal of funds, etc.
If you think you are seeing this message by mistake and your location is not the US, kindly proceed to the website. Otherwise, you must leave the website in order to comply with government restrictions.
Why does your IP address show your location as the USA?
Please confirm whether you are a US resident or not by clicking the relevant button below. If you choose the wrong option, being a US resident, you will not be able to open an account with InstaTrade anyway.
We are sorry for any inconvenience caused by this message.


