See also


 21.11.2023 08:08 AM
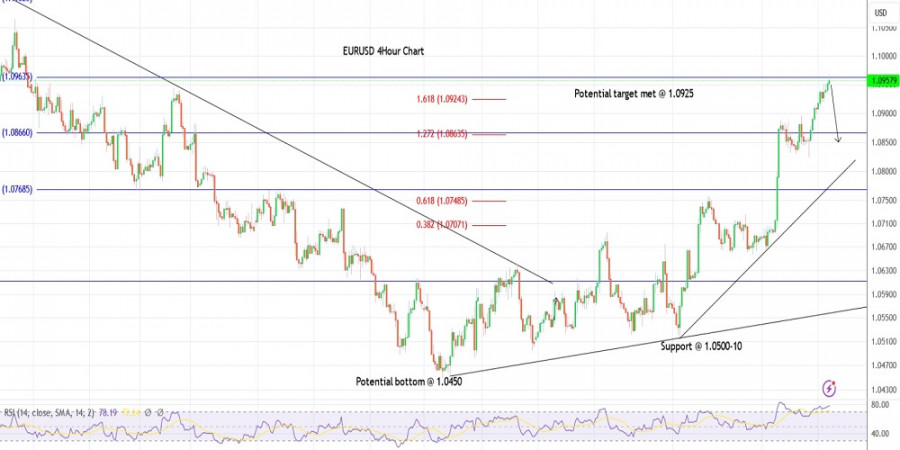
EUR/USD rose through the 1.0950-60 area on Tuesday, hitting the Fibonacci 0.618 retracement of the earlier drop between 1.1275 and 1.0450 levels respectively. The single currency pair is seen to be trading close to 1.0955 at this point in writing and could turn lower from here soon. The initial support is at 1.0825 and the bears would be targeting that for now.
EUR/USD might have completed a flat corrective structure, which began from the 1.0450 lows earlier. Ideally, the bears should be back in control from here and resume lower towards its larger-degree downtrend and break below 1.0450 going forward. Prices should stay below 1.1275 to keep the above bearish structure intact.
EUR/USD is also indicating a bearish divergence on the 4H RSI as highlighted on the chart here. As prices rallied past the 1.0960 high, the RSI failed to break higher, which is a highly probable indicator of a potential turn ahead. Only a significant push above 1.1100 would nullify the above bearish structure. For now, the bears are poised to break below 1.0825.
A potential trend reversal against 1.1275 to resume soon.
Good luck!
You have already liked this post today
*The market analysis posted here is meant to increase your awareness, but not to give instructions to make a trade.
Analysis of Wednesday's Trades 1H Chart of GBP/USD The GBP/USD pair showed no notable movements on Wednesday. After Jerome Powell stated the need for more time to assess the full
Analysis of Wednesday's Trades 1H Chart of EUR/USD The EUR/USD currency pair continued to trade within the sideways channel on Wednesday, which is visible on the hourly timeframe
On Wednesday, the GBP/USD currency pair continued trading within a sideways channel, clearly visible on the hourly timeframe. There was virtually no movement throughout the day, and no fundamental
On Wednesday, the EUR/USD currency pair continued to trade in the same flat range. The 1.1274 and 1.1426 levels bound the broader sideways channel, while the narrower channel ranges between
In my morning forecast, I highlighted the 1.1379 level and planned to base market entry decisions around it. Let's look at the 5-minute chart to understand what happened. A rise
Analysis of Tuesday's Trades 1H Chart of GBP/USD The GBP/USD pair exhibited a notable upward movement on Tuesday, although it remains within a sideways channel that may not be immediately
Analysis of Tuesday's Trades 1H Chart of EUR/USD On Tuesday, the EUR/USD currency pair traded completely flat. Throughout the day, there were no significant reports or events either
On Tuesday, the GBP/USD currency pair suddenly and unexpectedly resumed upward movement. While the euro was stuck in a flat market, the British pound showed a strong rally, and again
E-mail/SMS
notifications

Your IP address shows that you are currently located in the USA. If you are a resident of the United States, you are prohibited from using the services of InstaFintech Group including online trading, online transfers, deposit/withdrawal of funds, etc.
If you think you are seeing this message by mistake and your location is not the US, kindly proceed to the website. Otherwise, you must leave the website in order to comply with government restrictions.
Why does your IP address show your location as the USA?
Please confirm whether you are a US resident or not by clicking the relevant button below. If you choose the wrong option, being a US resident, you will not be able to open an account with InstaTrade anyway.
We are sorry for any inconvenience caused by this message.

