See also


 15.11.2023 07:54 AM
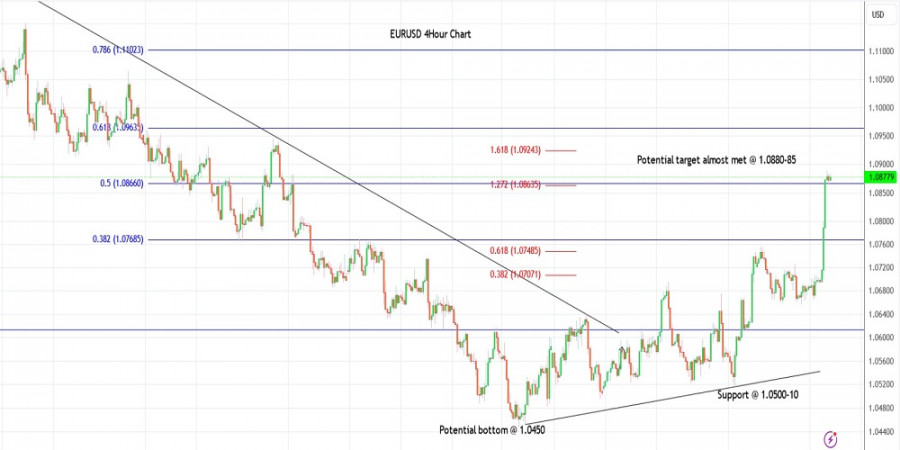
EUR/USD rallied sharply on Tuesday during the New York Session reaching the 1.0887 high. The single currency has hit the Fibonacci .1.27 extension and is just a few points away from taking out the 1.0930 high. Also, note that the price has tested the Fibonacci 0.50 retracement of the earlier downswing between 1.1275 and 1.0450 as the bears might be preparing to turn prices lower again.
The above rally in EUR/USD has been in line with our projections almost terminating the counter-trend rally close to 1.0900. We might witness another push higher before prices turn lower again. Most traders might be inclined to take profits on the long positions initiated earlier as resistance should be strong around the 1.0890-1.0930 zone.
EUR/USD has either completed its corrective wave around 1.0885-90 or it is close to termination. Please note that the Fibonacci 0.618 retracement of the above drop is seen passing through the 1.0930-50 range which should act as a potential reversal zone if prices manage to reach there. Immediate resistance is also seen around 1.0945.
A potential rally is near to complete at 1.0887. Prepare to turn bearish again.
Good luck!
You have already liked this post today
*The market analysis posted here is meant to increase your awareness, but not to give instructions to make a trade.
On Friday, the GBP/USD currency pair initially exited its sideways channel but quickly and confidently recovered to the Senkou Span B line. From a technical standpoint, the flat range could
The EUR/USD currency pair could not continue its downward movement on Friday. This is not surprising, as any dollar growth is achieved with significant effort. Regardless of the macroeconomic
There are no macroeconomic events scheduled for Friday. Fundamental developments will also be limited, but it's entirely unclear which factors influence price formation. The pound and the euro had reasons
Analysis of Thursday's Trades 1H Chart of GBP/USD On Thursday, the GBP/USD pair continued its choppy decline within the sideways channel and failed to break out, unlike the EUR/USD pair
Analysis of Thursday's Trades 1H Chart of EUR/USD On Thursday, the EUR/USD currency pair unexpectedly exited the sideways channel where it had been trading for three weeks. This occurred during
On Thursday, the GBP/USD currency pair continued trading within the sideways channel, visible in the hourly timeframe. Two central bank meetings — each of which could be considered favorable

Your IP address shows that you are currently located in the USA. If you are a resident of the United States, you are prohibited from using the services of InstaFintech Group including online trading, online transfers, deposit/withdrawal of funds, etc.
If you think you are seeing this message by mistake and your location is not the US, kindly proceed to the website. Otherwise, you must leave the website in order to comply with government restrictions.
Why does your IP address show your location as the USA?
Please confirm whether you are a US resident or not by clicking the relevant button below. If you choose the wrong option, being a US resident, you will not be able to open an account with InstaTrade anyway.
We are sorry for any inconvenience caused by this message.

