See also


 12.05.2022 03:17 PM
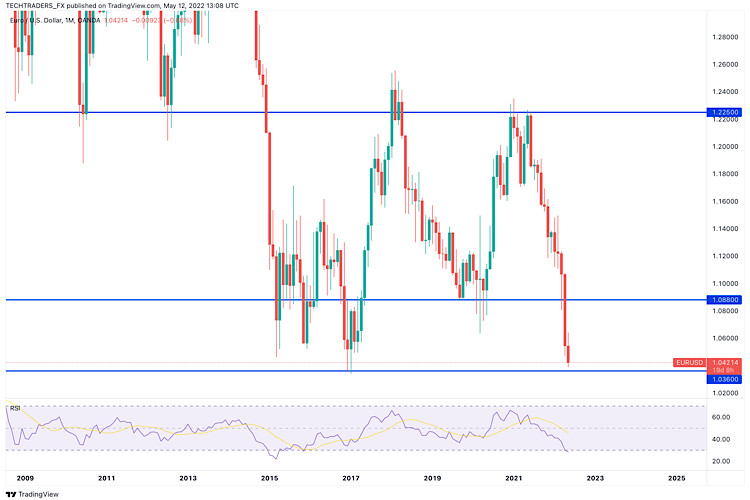
EUR/USD has recovered modestly from the fresh multi-year low it set below 1.0400 earlier in the day. The data from the US showed that the Producer Price Index (PPI) edged lower to 11% on a yearly basis in April from 11.5% in March, causing the US Dollar Index to erase a portion of its daily gains.
The EUR/USD pair currently trades a handful of pips above the 1.0400 threshold, but the daily chart suggests that the pair could still continue to fall. The pair has finally found some directional strength after a consolidative stage, and technical indicators reflect so, heading firmly lower near oversold readings. At the same time, the pair develops well below bearish moving averages, also reflecting prevalent selling interest.
For the near term, and according to the 4-hour chart, the risk remains skewed to the downside. Technical indicators maintain their bearish slopes, despite being near oversold readings, while the pair gave up after repeatedly failing to advance beyond a mildly bearish 20 SMA. Renewed selling pressure below the aforementioned daily low exposes January 2017 multi-year low at 1.0339.
Support levels: 1.0385 1.0340 1.0295
Resistance levels: 1.0470 1.0510 1.0550
You have already liked this post today
*The market analysis posted here is meant to increase your awareness, but not to give instructions to make a trade.
Useful links: My other articles are available in this section InstaForex course for beginners Popular Analytics Open trading account Important: The begginers in forex trading need to be very careful
From what we see on the 4-hour chart of the Nasdaq 100 index, there are several interesting things, namely, first, the price movement is moving below the MA (100), second
Early in the American session, gold is trading around 3,312 with a bullish bias after breaking out of the symmetrical triangle. Gold is now likely to continue rising
Useful links: My other articles are available in this section InstaForex course for beginners Popular Analytics Open trading account Important: The begginers in forex trading need to be very careful
On the 4-hour chart, the USD/CAD commodity currency pair can be seen moving below the EMA (100) and the appearance of a Bearish 123 pattern and the position
With the Stochastic Oscillator condition heading towards the Oversold level (20) on the 4-hour chart of the AUD/JPY cross currency pair, in the near future AUD/JPY has the potential
Your IP address shows that you are currently located in the USA. If you are a resident of the United States, you are prohibited from using the services of InstaFintech Group including online trading, online transfers, deposit/withdrawal of funds, etc.
If you think you are seeing this message by mistake and your location is not the US, kindly proceed to the website. Otherwise, you must leave the website in order to comply with government restrictions.
Why does your IP address show your location as the USA?
Please confirm whether you are a US resident or not by clicking the relevant button below. If you choose the wrong option, being a US resident, you will not be able to open an account with InstaTrade anyway.
We are sorry for any inconvenience caused by this message.

