See also


 10.04.2025 10:14 AM
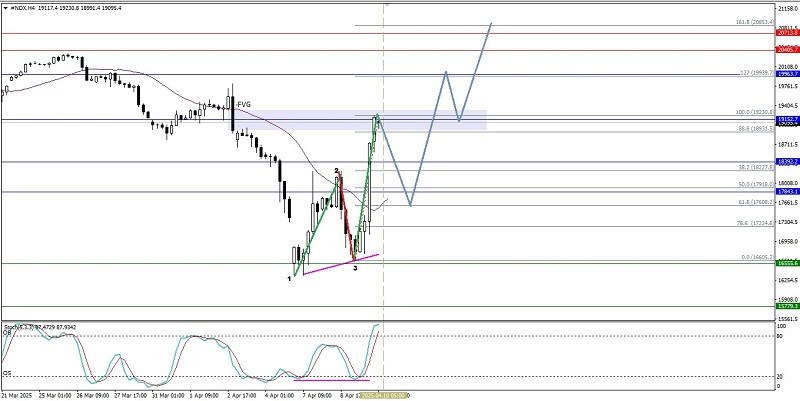
From what is visible on the 4-hour chart of the Nasdaq 100 index, although there is currently a strengthening in #NDX, this is confirmed by its price movement moving above the WMA (30 Shift 2) which also has a slope that dives upwards and is supported by the appearance of Convergence between the #NDX price movement and the Stochastic Oscillator indicator, but because it is stuck at the current Bearish Fair Value Gap area level, the index has the potential to experience a weakening correction, but as long as it does not break through and close below the 16340.7 level, #NDX still has the potential to strengthen again to the 19939.7 level and if the volatility and momentum of its strengthening support it, the 20853.4 level will be the next target to be tested.
(Disclaimer)
You have already liked this post today
*The market analysis posted here is meant to increase your awareness, but not to give instructions to make a trade.
Early in the American session, the EUR/USD pair is trading around 1.1345, reaching the top of the downtrend channel and showing signs of exhaustion. The euro could resume its bearish
Useful links: My other articles are available in this section InstaForex course for beginners Popular Analytics Open trading account Important: The begginers in forex trading need to be very careful
By looking at the 4-hour chart of the EUR/JPY cross currency pair, it appears that in the near future EUR/JPY has the potential to strengthen, which is confirmed
Your IP address shows that you are currently located in the USA. If you are a resident of the United States, you are prohibited from using the services of InstaFintech Group including online trading, online transfers, deposit/withdrawal of funds, etc.
If you think you are seeing this message by mistake and your location is not the US, kindly proceed to the website. Otherwise, you must leave the website in order to comply with government restrictions.
Why does your IP address show your location as the USA?
Please confirm whether you are a US resident or not by clicking the relevant button below. If you choose the wrong option, being a US resident, you will not be able to open an account with InstaTrade anyway.
We are sorry for any inconvenience caused by this message.

