

Actual patterns

Patterns are graphical models which are formed in the chart by the price. According to one of the technical analysis postulates, history (price movement) repeats itself. It means that the price movements are often similar in the same situations which makes it possible to predict the further development of the situation with a high probability.
Relevant patterns by InstaTrade is an easy-to-use service which allows you to be aware of latest changes in the market and react to clues from the market in time. In our service you will always find the latest and most relevant patterns on any pair and any timeframe.
Double Top
was formed on 02.04 at 09:00:10 (UTC+0)
signal strength 3 of 5
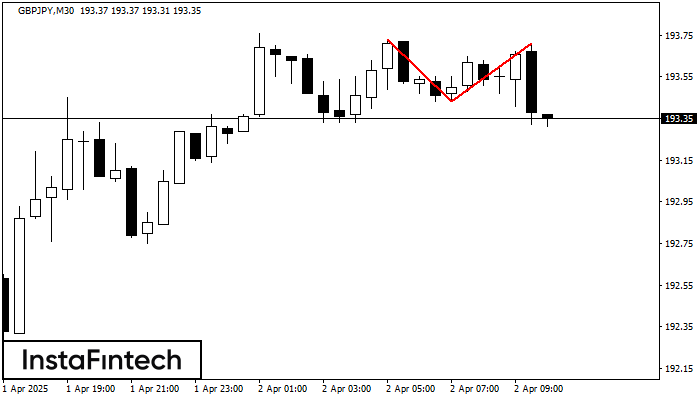
On the chart of GBPJPY M30 the Double Top reversal pattern has been formed. Characteristics: the upper boundary 193.71; the lower boundary 193.43; the width of the pattern 28 points. The signal: a break of the lower boundary will cause continuation of the downward trend targeting the 193.13 level.
- All
- All
- Bearish Rectangle
- Bearish Symmetrical Triangle
- Bearish Symmetrical Triangle
- Bullish Rectangle
- Double Top
- Double Top
- Triple Bottom
- Triple Bottom
- Triple Top
- Triple Top
- All
- All
- Buy
- Sale
- All
- 1
- 2
- 3
- 4
- 5
Bawah Triple
was formed on 23.04 at 12:15:11 (UTC+0)
signal strength 2 of 5

Pola Bawah Triple telah terbentuk pada grafik instrumen trading USDJPY M15. Pola tersebut menandakan perubahan dalam trend dari menurun menjadi naik jika terjadi pemecahan (breakdown) 142.25/141.96
Rangka waktu M5 dan M15 mungkin memiliki lebih dari titik entri yang keliru.
Open chart in a new window
Bawah Ganda
was formed on 23.04 at 12:00:11 (UTC+0)
signal strength 2 of 5

Pola Bawah Ganda telah terbentuk pada USDJPY M15; batas atas di 141.96; batas bawah di 141.59. Lebar pola sebesar 41 poin. Jika harga menembus batas atas 141.96, Perubahan dalam tren
Rangka waktu M5 dan M15 mungkin memiliki lebih dari titik entri yang keliru.
Open chart in a new window
Segitiga Simetris Bullish
was formed on 23.04 at 11:41:41 (UTC+0)
signal strength 2 of 5

Menurut Grafik dari M15, NZDJPY dibentuk pola Segitiga Simetris Bullish. Deskripsi: Ini merupakan pola dari kelanjutan tren. 85.15 dan 84.50 adalah kordinat masing-masing dari batas atas dan lebih rendah. Lebar
Rangka waktu M5 dan M15 mungkin memiliki lebih dari titik entri yang keliru.
Open chart in a new window


