

Actual patterns

Patterns are graphical models which are formed in the chart by the price. According to one of the technical analysis postulates, history (price movement) repeats itself. It means that the price movements are often similar in the same situations which makes it possible to predict the further development of the situation with a high probability.
Relevant patterns by InstaTrade is an easy-to-use service which allows you to be aware of latest changes in the market and react to clues from the market in time. In our service you will always find the latest and most relevant patterns on any pair and any timeframe.
Double Bottom
was formed on 31.03 at 13:30:19 (UTC+0)
signal strength 3 of 5
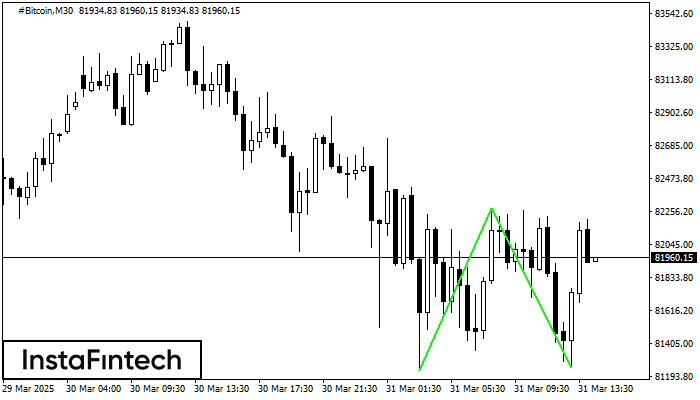
The Double Bottom pattern has been formed on #Bitcoin M30. This formation signals a reversal of the trend from downwards to upwards. The signal is that a buy trade should be opened after the upper boundary of the pattern 82275.64 is broken. The further movements will rely on the width of the current pattern 104454 points.
- All
- All
- Bearish Rectangle
- Bearish Symmetrical Triangle
- Bearish Symmetrical Triangle
- Bullish Rectangle
- Double Top
- Double Top
- Triple Bottom
- Triple Bottom
- Triple Top
- Triple Top
- All
- All
- Buy
- Sale
- All
- 1
- 2
- 3
- 4
- 5
Pennant de alta
was formed on 10.06 at 16:15:49 (UTC+0)
signal strength 1 of 5
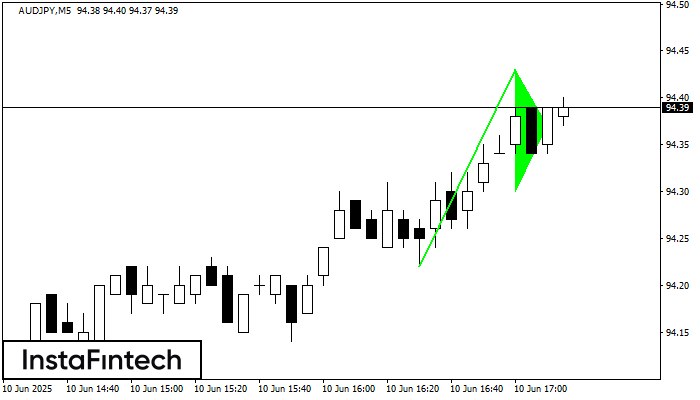
O sinal de Pennant de alta – Instrumento de negociação AUDJPY M5, padrão de continuação. Previsão: é possível definir uma posição de compra acima da altura do padrão de 94.43
Os intervalos M5 e M15 podem ter mais pontos de entrada falsos.
Open chart in a new window
Fundo triplo
was formed on 10.06 at 16:15:07 (UTC+0)
signal strength 2 of 5
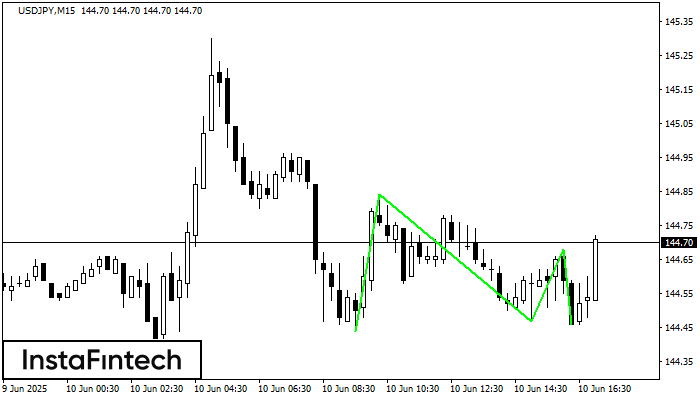
O padrão Fundo triplo foi formado no gráfico do instrumento de negociação USDJPY M15. O padrão sinaliza uma mudança na tendência de baixa para alta no caso de quebra
Os intervalos M5 e M15 podem ter mais pontos de entrada falsos.
Open chart in a new window
Bandeira de Alta
was formed on 10.06 at 15:30:03 (UTC+0)
signal strength 1 of 5

O padrão Bandeira de Alta foi formado em #TSLA a M5. O limite inferior do padrão está localizado em 306.79/305.77, enquanto o limite superior está em 309.97/308.95. A projeção
Os intervalos M5 e M15 podem ter mais pontos de entrada falsos.
Open chart in a new window


