

Actual patterns

Patterns are graphical models which are formed in the chart by the price. According to one of the technical analysis postulates, history (price movement) repeats itself. It means that the price movements are often similar in the same situations which makes it possible to predict the further development of the situation with a high probability.
Relevant patterns by InstaTrade is an easy-to-use service which allows you to be aware of latest changes in the market and react to clues from the market in time. In our service you will always find the latest and most relevant patterns on any pair and any timeframe.
Double Bottom
was formed on 22.03 at 17:34:47 (UTC+0)
signal strength 1 of 5

The Double Bottom pattern has been formed on #Bitcoin M5. Characteristics: the support level 83931.70; the resistance level 84051.13; the width of the pattern 11943 points. If the resistance level is broken, a change in the trend can be predicted with the first target point lying at the distance of 10667 points.
The M5 and M15 time frames may have more false entry points.
- All
- All
- Bearish Rectangle
- Bearish Symmetrical Triangle
- Bearish Symmetrical Triangle
- Bullish Rectangle
- Double Top
- Double Top
- Triple Bottom
- Triple Bottom
- Triple Top
- Triple Top
- All
- All
- Buy
- Sale
- All
- 1
- 2
- 3
- 4
- 5
Hình chữ nhật giảm
was formed on 12.05 at 19:21:26 (UTC+0)
signal strength 1 of 5
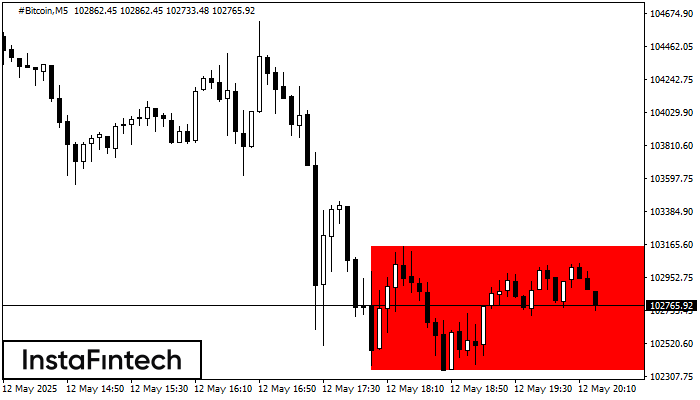
Theo biểu đồ của M5, #Bitcoin đã tạo thành Hình chữ nhật giảm. Mô hình này cho thấy sự tiếp tục của xu hướng. Đường viền trên là 103156.34, đường
Khung thời gian M5 và M15 có thể có nhiều điểm vào lệnh sai hơn.
Open chart in a new window
Đỉnh đôi
was formed on 12.05 at 19:05:36 (UTC+0)
signal strength 1 of 5
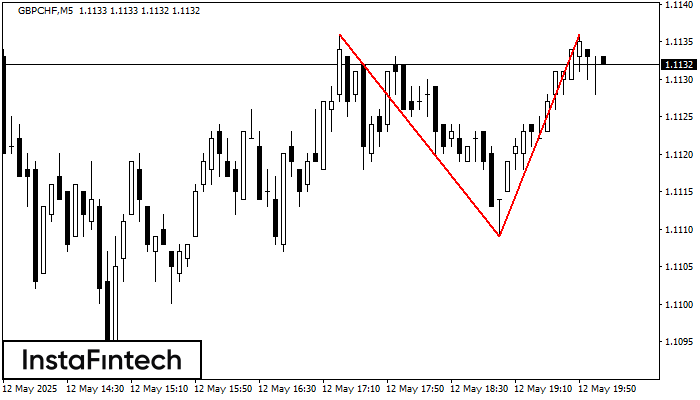
Trên biểu đồ GBPCHF M5, mô hình đảo chiều Đỉnh đôi đã được hình thành. Đặc điểm: ranh giới trên ở 1.1136; ranh giới dưới ở 1.1109; chiều rộng
Khung thời gian M5 và M15 có thể có nhiều điểm vào lệnh sai hơn.
Open chart in a new window
Tam giác Cân Tăng
was formed on 12.05 at 18:32:08 (UTC+0)
signal strength 2 of 5
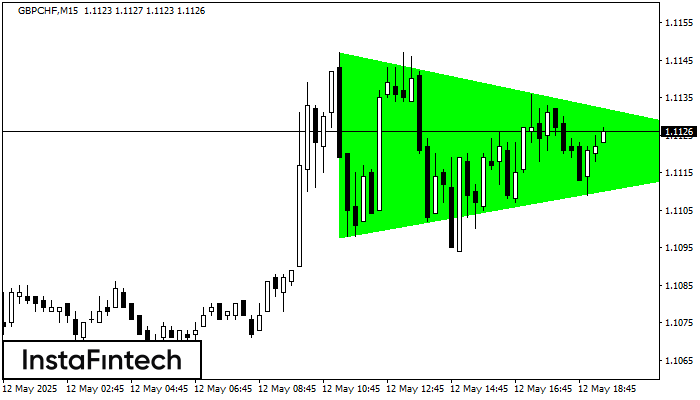
Theo biểu đồ của M15, GBPCHF đã hình thành mô hình Tam giác Cân Tăng, điều mà báo hiệu xu hướng sẽ tiếp tục. Mô tả. Đường biên giới
Khung thời gian M5 và M15 có thể có nhiều điểm vào lệnh sai hơn.
Open chart in a new window


