

Actual patterns

Patterns are graphical models which are formed in the chart by the price. According to one of the technical analysis postulates, history (price movement) repeats itself. It means that the price movements are often similar in the same situations which makes it possible to predict the further development of the situation with a high probability.
Relevant patterns by InstaTrade is an easy-to-use service which allows you to be aware of latest changes in the market and react to clues from the market in time. In our service you will always find the latest and most relevant patterns on any pair and any timeframe.
Triple Top
was formed on 14.04 at 18:00:11 (UTC+0)
signal strength 4 of 5
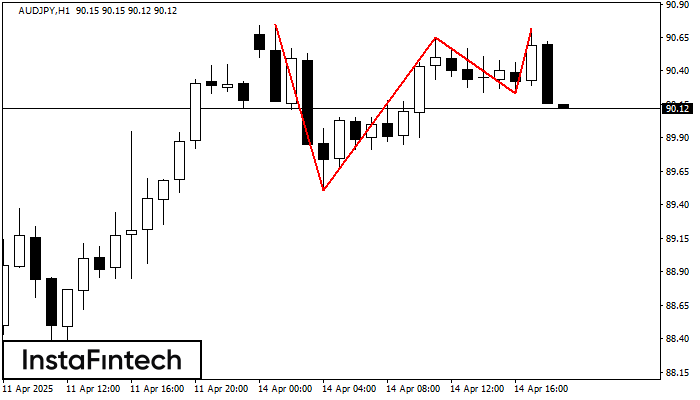
On the chart of the AUDJPY H1 trading instrument, the Triple Top pattern that signals a trend change has formed. It is possible that after formation of the third peak, the price will try to break through the resistance level 89.51, where we advise to open a trading position for sale. Take profit is the projection of the pattern’s width, which is 124 points.
- All
- All
- Bearish Rectangle
- Bearish Symmetrical Triangle
- Bearish Symmetrical Triangle
- Bullish Rectangle
- Double Top
- Double Top
- Triple Bottom
- Triple Bottom
- Triple Top
- Triple Top
- All
- All
- Buy
- Sale
- All
- 1
- 2
- 3
- 4
- 5
Persegi Bearish
was formed on 04.05 at 00:51:55 (UTC+0)
signal strength 3 of 5

Menurut grafik dari M30, #Bitcoin terbentuk Persegi Bearish. Jenis pola ini menunjukkan kelanjutan tren. Terdiri dari dua tingkat: resistance 96456.78 - 0.00 dan support 95805.26 – 95805.26. Jika level resistance
Open chart in a new window
Bawah Ganda
was formed on 03.05 at 10:45:44 (UTC+0)
signal strength 2 of 5

Pola Bawah Ganda telah terbentuk pada #Bitcoin M15. Formasi ini mensinyalkan reversal tren dari arah penurunan ke arah kenaikan. Sinyal menunjukkan bahwa transaksi beli harus dibuka setelah batas atas pola
Rangka waktu M5 dan M15 mungkin memiliki lebih dari titik entri yang keliru.
Open chart in a new window
Bawah Ganda
was formed on 03.05 at 08:00:01 (UTC+0)
signal strength 3 of 5

Pola Bawah Ganda telah terbentuk pada #Bitcoin M30; batas atas di 97860.25; batas bawah di 96258.44. Lebar pola sebesar 156618 poin. Jika harga menembus batas atas 97860.25, Perubahan dalam tren
Open chart in a new window


