

Actual patterns

Patterns are graphical models which are formed in the chart by the price. According to one of the technical analysis postulates, history (price movement) repeats itself. It means that the price movements are often similar in the same situations which makes it possible to predict the further development of the situation with a high probability.
Relevant patterns by InstaTrade is an easy-to-use service which allows you to be aware of latest changes in the market and react to clues from the market in time. In our service you will always find the latest and most relevant patterns on any pair and any timeframe.
Bullish pennant
was formed on 25.03 at 19:30:15 (UTC+0)
signal strength 4 of 5
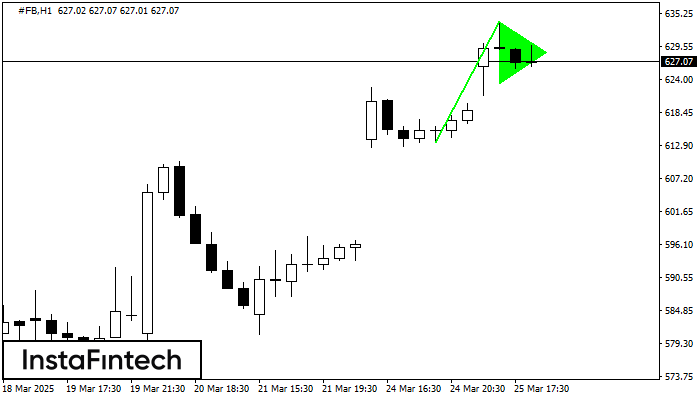
The Bullish pennant graphic pattern has formed on the #FB H1 instrument. This pattern type falls under the category of continuation patterns. In this case, if the quote can breaks out high, is expected to continue the upward trend to level 634.22.
See Also
- All
- All
- Bearish Rectangle
- Bearish Symmetrical Triangle
- Bearish Symmetrical Triangle
- Bullish Rectangle
- Double Top
- Double Top
- Triple Bottom
- Triple Bottom
- Triple Top
- Triple Top
- All
- All
- Buy
- Sale
- All
- 1
- 2
- 3
- 4
- 5
Прямоугольник
сформирован 04.05 в 00:51:55 (UTC+0)
сила сигнала 3 из 5

По #Bitcoin M30 сформировалась фигура - «Прямоугольник». Фигура данного типа относится к тому типу продолжения тренда, который имеет два уровня: Сопротивление 96456.78; Поддержка 95805.26. В случае пробоя уровня поддержки 95805.26
Открыть график инструмента в новом окне
Двойное дно
сформирован 03.05 в 10:45:44 (UTC+0)
сила сигнала 2 из 5

Сформирована фигура «Двойное дно» на графике #Bitcoin M15. Данное формирование сигнализирует об изменении тенденции с нисходящего на восходящее движение. Сигнал: Торговую позицию на покупку следует открывать после пробоя верхней границы
Таймфреймы М5 и М15 могут иметь больше ложных точек входа.
Открыть график инструмента в новом окне
Двойное дно
сформирован 03.05 в 08:00:01 (UTC+0)
сила сигнала 3 из 5

Сформирована фигура «Двойное дно» на графике #Bitcoin M30. Верхняя граница 97860.25; Нижняя граница 96258.44; Ширина фигуры 156618 пунктов. В случае пробоя верхней границы 97860.25 можно будет прогнозировать изменение тенденции
Открыть график инструмента в новом окне


