

实际模式

模式是通过价格在图表中形成的图形模型。 根据其中一项技术分析规定,历史(价格变动)重演。 这意味着价格变动在相同的情况下通常是相似的,这使得有可能以高概率预测情况的进一步发展。
InstaTrade的相关模式是一款易于使用的服务,可让您了解市场的最新变化并及时对市场线索做出反应。 在我们的服务中,您始终可以在任何货币对以及任何时间范围内找到最新和最相关的模式。
Double Top
was formed on 15.04 at 21:47:34 (UTC+0)
signal strength 2 of 5
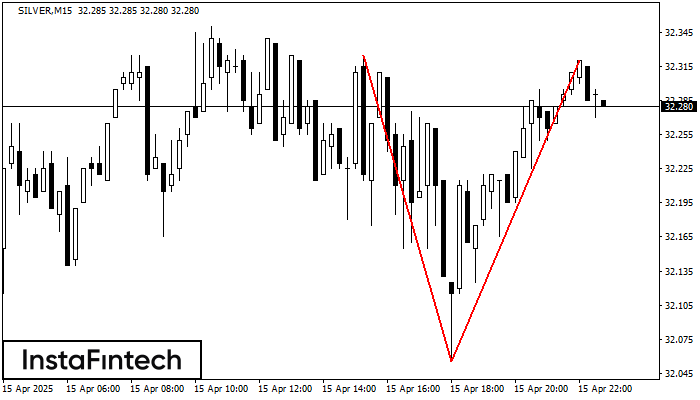
The Double Top reversal pattern has been formed on SILVER M15. Characteristics: the upper boundary 32.33; the lower boundary 32.05; the width of the pattern is 265 points. Sell trades are better to be opened below the lower boundary 32.05 with a possible movements towards the 32.03 level.
The M5 and M15 time frames may have more false entry points.
See Also
- All
- All
- Bearish Rectangle
- Bearish Symmetrical Triangle
- Bearish Symmetrical Triangle
- Bullish Rectangle
- Double Top
- Double Top
- Triple Bottom
- Triple Bottom
- Triple Top
- Triple Top
- All
- All
- Buy
- Sale
- All
- 1
- 2
- 3
- 4
- 5
Bearish Symmetrical Triangle
was formed on 07.05 at 15:29:43 (UTC+0)
signal strength 2 of 5
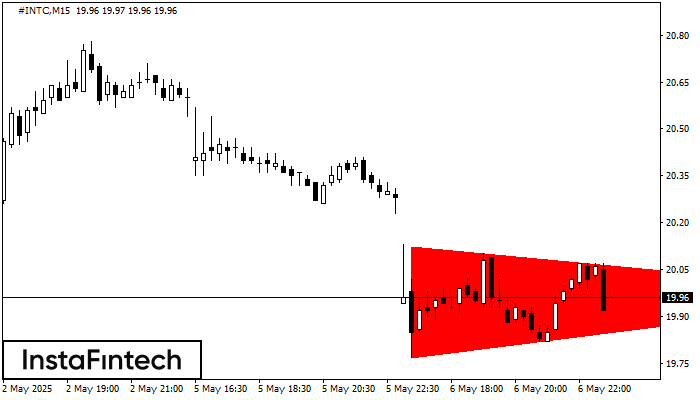
According to the chart of M15, #INTC formed the Bearish Symmetrical Triangle pattern. Trading recommendations: A breach of the lower border 19.77 is likely to encourage a continuation
The M5 and M15 time frames may have more false entry points.
Open chart in a new window
Bearish Symmetrical Triangle
was formed on 07.05 at 15:22:28 (UTC+0)
signal strength 2 of 5
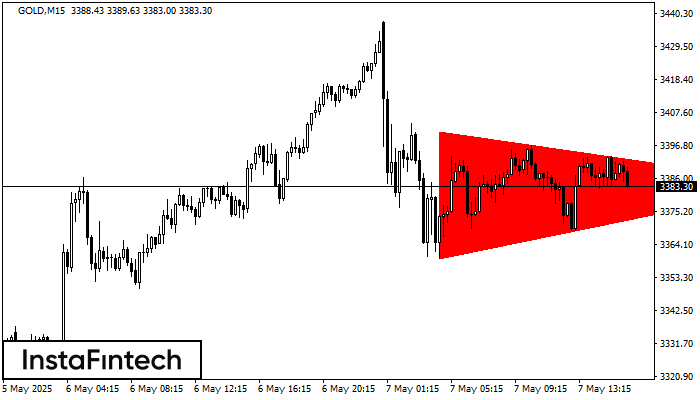
According to the chart of M15, GOLD formed the Bearish Symmetrical Triangle pattern. This pattern signals a further downward trend in case the lower border 3359.66 is breached. Here
The M5 and M15 time frames may have more false entry points.
Open chart in a new window
Bullish pennant
was formed on 07.05 at 15:02:22 (UTC+0)
signal strength 2 of 5
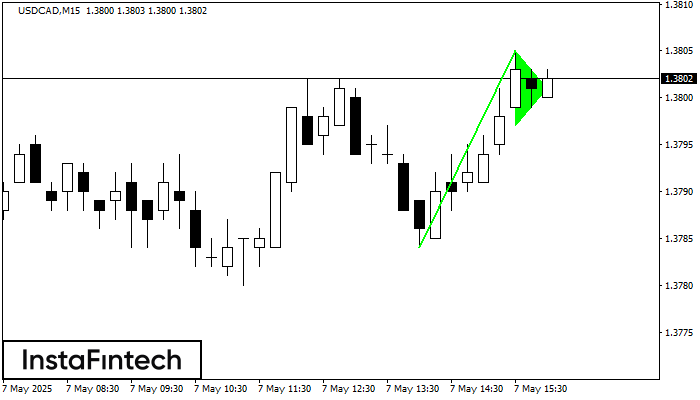
The Bullish pennant pattern is formed on the USDCAD M15 chart. It is a type of the continuation pattern. Supposedly, in case the price is fixed above the pennant’s high
The M5 and M15 time frames may have more false entry points.
Open chart in a new window


