

实际模式

模式是通过价格在图表中形成的图形模型。 根据其中一项技术分析规定,历史(价格变动)重演。 这意味着价格变动在相同的情况下通常是相似的,这使得有可能以高概率预测情况的进一步发展。
InstaTrade的相关模式是一款易于使用的服务,可让您了解市场的最新变化并及时对市场线索做出反应。 在我们的服务中,您始终可以在任何货币对以及任何时间范围内找到最新和最相关的模式。
Bearish pennant
was formed on 07.04 at 00:45:25 (UTC+0)
signal strength 2 of 5
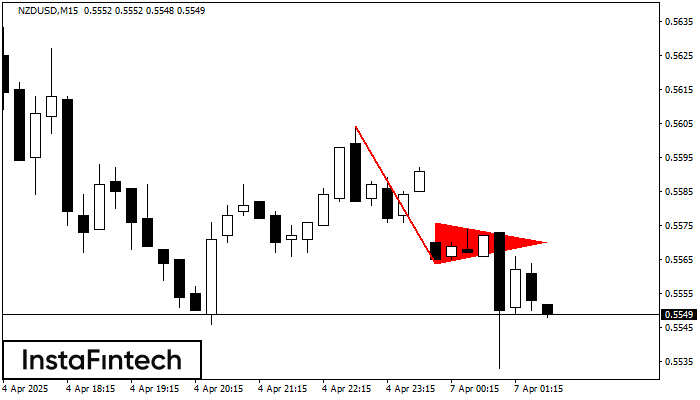
The Bearish pennant pattern has formed on the NZDUSD M15 chart. It signals potential continuation of the existing trend. Specifications: the pattern’s bottom has the coordinate of 0.5564; the projection of the flagpole height is equal to 40 pips. In case the price breaks out the pattern’s bottom of 0.5564, the downtrend is expected to continue for further level 0.5541.
The M5 and M15 time frames may have more false entry points.
- All
- All
- Bearish Rectangle
- Bearish Symmetrical Triangle
- Bearish Symmetrical Triangle
- Bullish Rectangle
- Double Top
- Double Top
- Triple Bottom
- Triple Bottom
- Triple Top
- Triple Top
- All
- All
- Buy
- Sale
- All
- 1
- 2
- 3
- 4
- 5
Inverse Head dan Shoulder
was formed on 09.05 at 08:00:23 (UTC+0)
signal strength 2 of 5
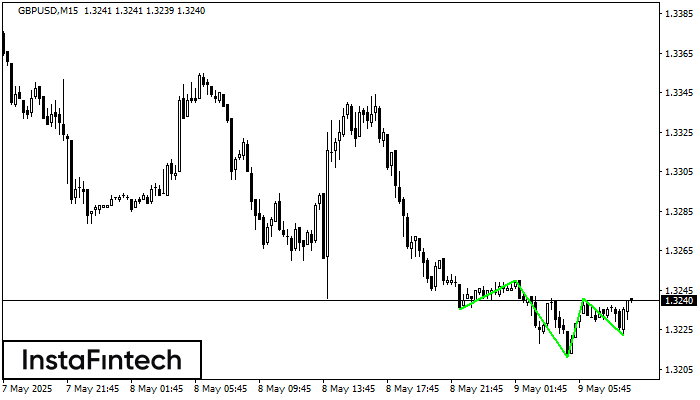
Berdasarkan carta M15, GBPUSD menghasilkan corak yang dinyatakan Inverse Head dan Shoulder. Head telah ditetapkan pada 1.3211 manakala garisan median Neck ditetapkan pada 1.3250/1.3241. Pembentukan Corak Inverse Head dan Shoulder
Carta masa M5 dan M15 mungkin mempunyai lebih banyak titik kemasukan palsu.
Open chart in a new window
Double Bottom
was formed on 09.05 at 08:00:13 (UTC+0)
signal strength 2 of 5
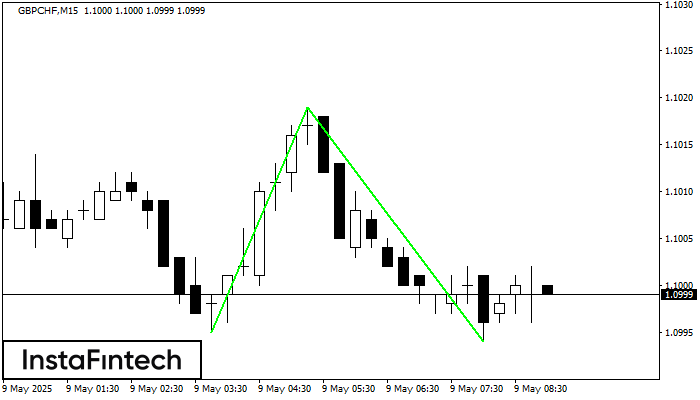
Corak Double Bottom telah dibentuk pada GBPCHF M15; sempadan atas adalah 1.1019; sempadan bawah adalah 1.0994. Lebar corak adalah 24 mata. Sekiranya penembusan sempadan atas 1.1019, perubahan aliran boleh diramalkan
Carta masa M5 dan M15 mungkin mempunyai lebih banyak titik kemasukan palsu.
Open chart in a new window
Inverse Head dan Shoulder
was formed on 09.05 at 08:00:07 (UTC+0)
signal strength 2 of 5
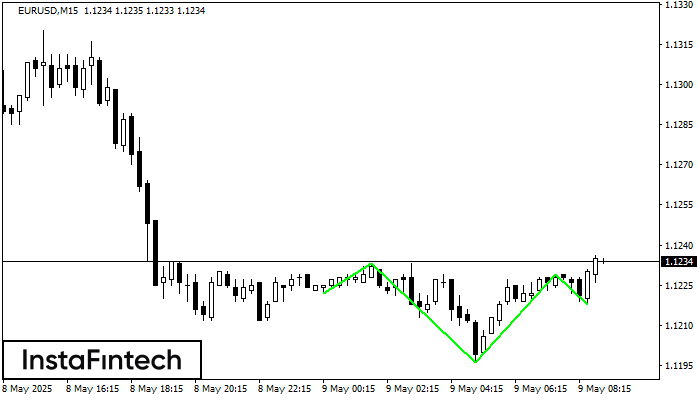
According to M15, EURUSD is shaping the technical pattern – the Inverse Head dan Shoulder. In case the Neckline 1.1233/1.1229 is broken out, the instrument is likely to move toward
Carta masa M5 dan M15 mungkin mempunyai lebih banyak titik kemasukan palsu.
Open chart in a new window


