

实际模式

模式是通过价格在图表中形成的图形模型。 根据其中一项技术分析规定,历史(价格变动)重演。 这意味着价格变动在相同的情况下通常是相似的,这使得有可能以高概率预测情况的进一步发展。
InstaTrade的相关模式是一款易于使用的服务,可让您了解市场的最新变化并及时对市场线索做出反应。 在我们的服务中,您始终可以在任何货币对以及任何时间范围内找到最新和最相关的模式。
Bullish Symmetrical Triangle
was formed on 04.04 at 05:20:08 (UTC+0)
signal strength 1 of 5

According to the chart of M5, #Bitcoin formed the Bullish Symmetrical Triangle pattern. Description: This is the pattern of a trend continuation. 83376.14 and 82331.42 are the coordinates of the upper and lower borders respectively. The pattern width is measured on the chart at 104472 pips. Outlook: If the upper border 83376.14 is broken, the price is likely to continue its move by 82907.57.
The M5 and M15 time frames may have more false entry points.
- All
- All
- Bearish Rectangle
- Bearish Symmetrical Triangle
- Bearish Symmetrical Triangle
- Bullish Rectangle
- Double Top
- Double Top
- Triple Bottom
- Triple Bottom
- Triple Top
- Triple Top
- All
- All
- Buy
- Sale
- All
- 1
- 2
- 3
- 4
- 5
Persegi Bearish
was formed on 21.05 at 19:30:17 (UTC+0)
signal strength 4 of 5
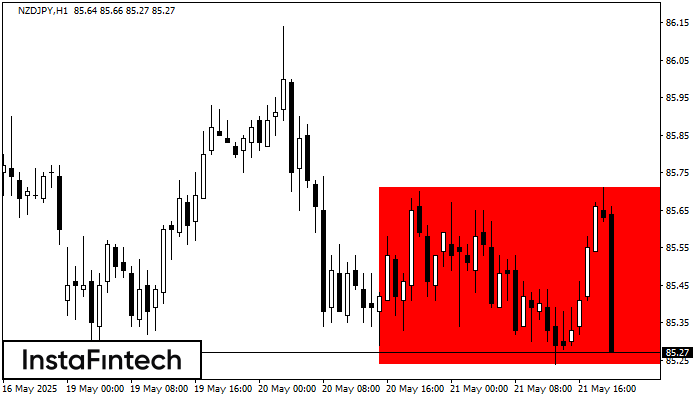
Menurut grafik dari H1, NZDJPY terbentuk Persegi Bearish yang merupakan pola dari kelanjutan tren. Pola terkandung di dalam batas berikut: batas lebih rendah 85.24 – 85.24 dan batas atas 85.71
Open chart in a new window
Persegi Bearish
was formed on 21.05 at 19:27:17 (UTC+0)
signal strength 4 of 5
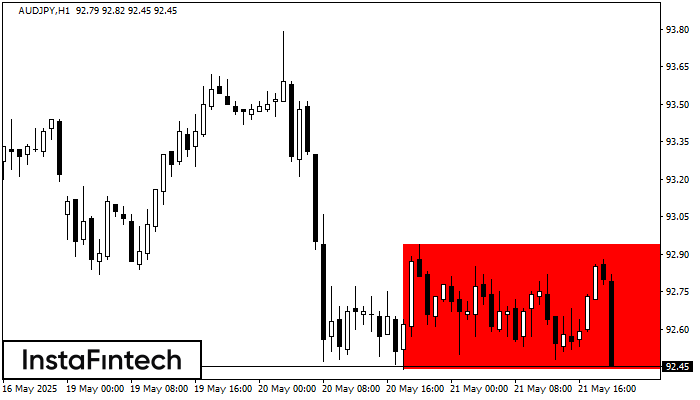
Menurut grafik dari H1, AUDJPY terbentuk Persegi Bearish. Pola menunjukkan kelanjutan tren. Batas atas adalah 92.94, batas rendah adalah 92.44. Sinyal berarti posisi jual harus dibuka setelah menetapkan harga dibawah
Open chart in a new window
Persegi Bearish
was formed on 21.05 at 19:27:14 (UTC+0)
signal strength 3 of 5
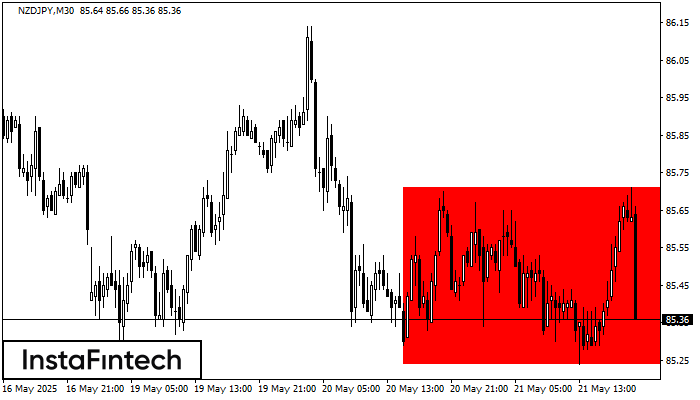
Menurut grafik dari M30, NZDJPY terbentuk Persegi Bearish yang merupakan pola dari kelanjutan tren. Pola terkandung di dalam batas berikut: batas lebih rendah 85.24 – 85.24 dan batas atas 85.71
Open chart in a new window


