

实际模式

模式是通过价格在图表中形成的图形模型。 根据其中一项技术分析规定,历史(价格变动)重演。 这意味着价格变动在相同的情况下通常是相似的,这使得有可能以高概率预测情况的进一步发展。
InstaTrade的相关模式是一款易于使用的服务,可让您了解市场的最新变化并及时对市场线索做出反应。 在我们的服务中,您始终可以在任何货币对以及任何时间范围内找到最新和最相关的模式。
Triple Top
was formed on 03.04 at 16:19:38 (UTC+0)
signal strength 1 of 5
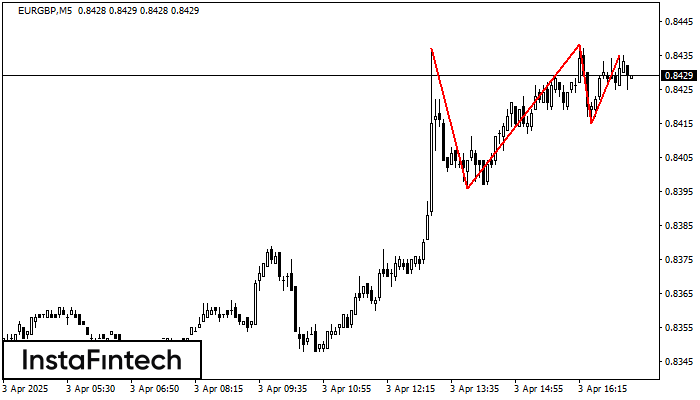
The Triple Top pattern has formed on the chart of the EURGBP M5. Features of the pattern: borders have an ascending angle; the lower line of the pattern has the coordinates 0.8396/0.8415 with the upper limit 0.8437/0.8435; the projection of the width is 41 points. The formation of the Triple Top figure most likely indicates a change in the trend from upward to downward. This means that in the event of a breakdown of the support level of 0.8396, the price is most likely to continue the downward movement.
The M5 and M15 time frames may have more false entry points.
- All
- All
- Bearish Rectangle
- Bearish Symmetrical Triangle
- Bearish Symmetrical Triangle
- Bullish Rectangle
- Double Top
- Double Top
- Triple Bottom
- Triple Bottom
- Triple Top
- Triple Top
- All
- All
- Buy
- Sale
- All
- 1
- 2
- 3
- 4
- 5
Kepala dan Bahu Terbalik
was formed on 14.05 at 09:05:23 (UTC+0)
signal strength 1 of 5

Menurut grafik dari M5, EURJPY membentuk pola Kepala dan Bahu Terbalik. Puncak kepala (Head) ditetapkan di 164.66 sementara garis median leher (Neck) ditemukan di 164.28/164.55. Formasi pola Kepala dan Bahu
Rangka waktu M5 dan M15 mungkin memiliki lebih dari titik entri yang keliru.
Open chart in a new window
Persegi Bullish
was formed on 14.05 at 09:03:44 (UTC+0)
signal strength 4 of 5
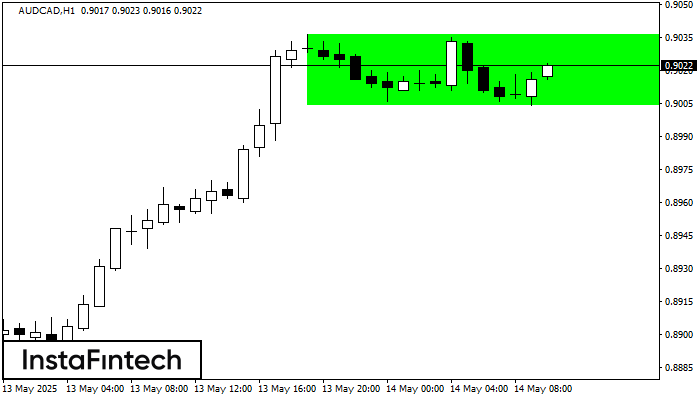
Menurut grafik dari H1, AUDCAD terbentuk Persegi Bullish. Pola menunjukkan kelanjutan tren. Batas atas adalah 0.9036, batas lebih rendah adalah 0.9004. Sinyal berarti posisi beli harus dibuka diatas batas atas
Open chart in a new window
Bawah Ganda
was formed on 14.05 at 09:00:12 (UTC+0)
signal strength 4 of 5
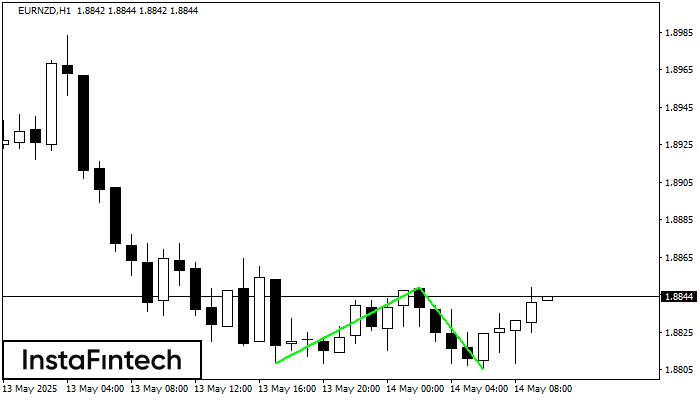
Pola Bawah Ganda telah terbentuk pada EURNZD H1. Formasi ini mensinyalkan reversal tren dari arah penurunan ke arah kenaikan. Sinyal menunjukkan bahwa transaksi beli harus dibuka setelah batas atas pola
Open chart in a new window


