

实际模式

模式是通过价格在图表中形成的图形模型。 根据其中一项技术分析规定,历史(价格变动)重演。 这意味着价格变动在相同的情况下通常是相似的,这使得有可能以高概率预测情况的进一步发展。
InstaTrade的相关模式是一款易于使用的服务,可让您了解市场的最新变化并及时对市场线索做出反应。 在我们的服务中,您始终可以在任何货币对以及任何时间范围内找到最新和最相关的模式。
Triple Bottom
was formed on 31.03 at 01:40:32 (UTC+0)
signal strength 1 of 5
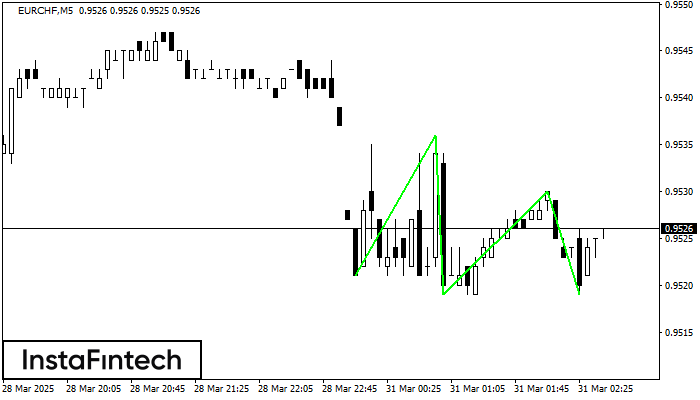
The Triple Bottom pattern has formed on the chart of EURCHF M5. Features of the pattern: The lower line of the pattern has coordinates 0.9536 with the upper limit 0.9536/0.9530, the projection of the width is 15 points. The formation of the Triple Bottom pattern most likely indicates a change in the trend from downward to upward. This means that in the event of a breakdown of the resistance level 0.9521, the price is most likely to continue the upward movement.
The M5 and M15 time frames may have more false entry points.
See Also
- All
- All
- Bearish Rectangle
- Bearish Symmetrical Triangle
- Bearish Symmetrical Triangle
- Bullish Rectangle
- Double Top
- Double Top
- Triple Bottom
- Triple Bottom
- Triple Top
- Triple Top
- All
- All
- Buy
- Sale
- All
- 1
- 2
- 3
- 4
- 5
Triângulo Simétrico de Alta
was formed on 20.05 at 18:57:46 (UTC+0)
signal strength 1 of 5
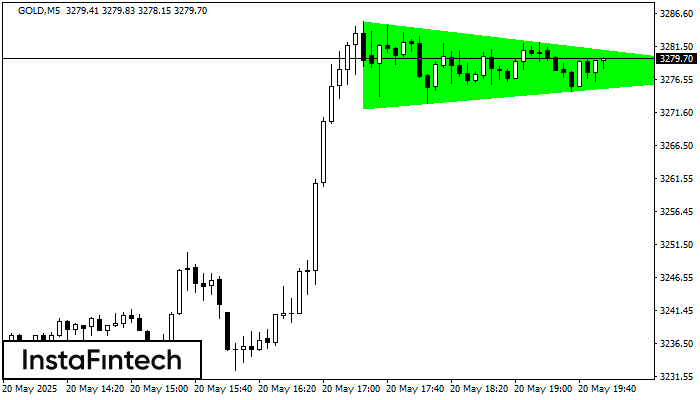
De acordo com o gráfico de M5, GOLD formaram o padrão de Triângulo Simétrico de Alta. Descrição: Este é o padrão de uma continuação de tendência. 3285.27 e 3272.11
Os intervalos M5 e M15 podem ter mais pontos de entrada falsos.
Open chart in a new window
Fundo triplo
was formed on 20.05 at 18:30:27 (UTC+0)
signal strength 3 of 5
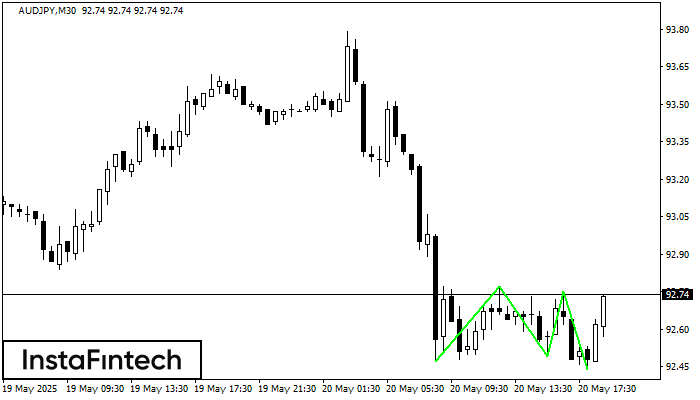
O padrão Fundo triplo foi formado no gráfico do instrumento de negociação AUDJPY M30. O padrão sinaliza uma mudança na tendência de baixa para alta no caso de quebra
Open chart in a new window
Fundo triplo
was formed on 20.05 at 18:15:46 (UTC+0)
signal strength 2 of 5
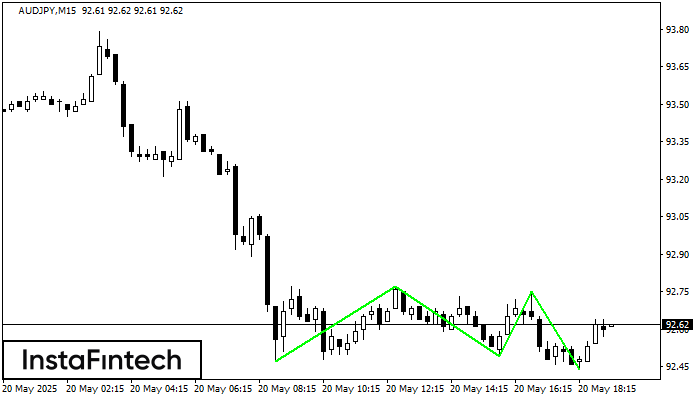
O padrão Fundo triplo foi formado no gráfico de AUDJPY M15. Características do padrão: A linha inferior do padrão tem coordenadas 92.77 com o limite superior 92.77/92.75, a projeção
Os intervalos M5 e M15 podem ter mais pontos de entrada falsos.
Open chart in a new window


