

实际模式

模式是通过价格在图表中形成的图形模型。 根据其中一项技术分析规定,历史(价格变动)重演。 这意味着价格变动在相同的情况下通常是相似的,这使得有可能以高概率预测情况的进一步发展。
InstaTrade的相关模式是一款易于使用的服务,可让您了解市场的最新变化并及时对市场线索做出反应。 在我们的服务中,您始终可以在任何货币对以及任何时间范围内找到最新和最相关的模式。
Bullish Rectangle
was formed on 25.03 at 21:10:08 (UTC+0)
signal strength 2 of 5
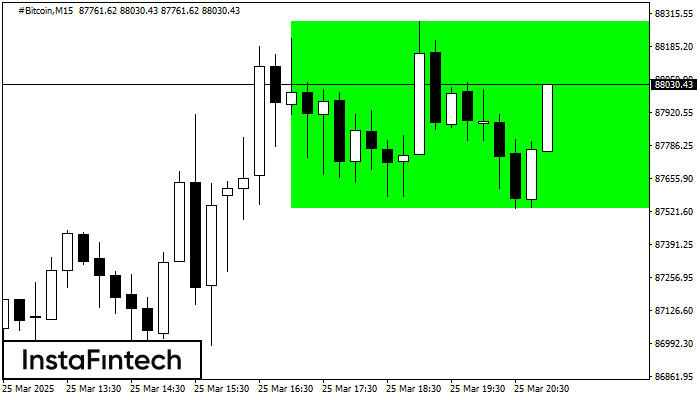
According to the chart of M15, #Bitcoin formed the Bullish Rectangle which is a pattern of a trend continuation. The pattern is contained within the following borders: the lower border 87534.22 – 87534.22 and upper border 88285.10 – 88285.10. In case the upper border is broken, the instrument is likely to follow the upward trend.
The M5 and M15 time frames may have more false entry points.
See Also
- All
- All
- Bearish Rectangle
- Bearish Symmetrical Triangle
- Bearish Symmetrical Triangle
- Bullish Rectangle
- Double Top
- Double Top
- Triple Bottom
- Triple Bottom
- Triple Top
- Triple Top
- All
- All
- Buy
- Sale
- All
- 1
- 2
- 3
- 4
- 5
Triángulo Simétrico Bajista
was formed on 17.04 at 22:35:23 (UTC+0)
signal strength 1 of 5
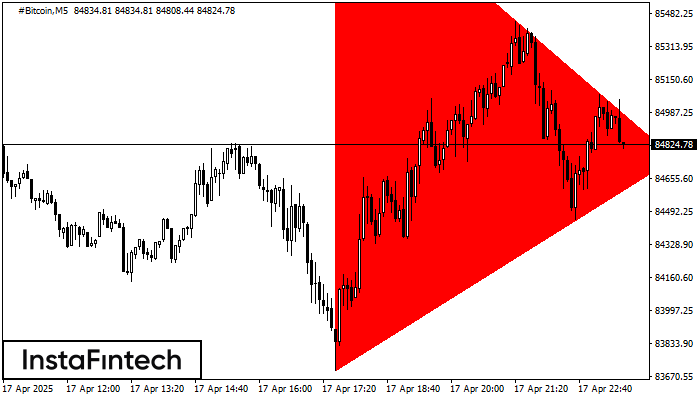
Según el gráfico de M5, el #Bitcoin formó el patrón Triángulo Simétrico Bajista. Recomendaciones de negociación: es posible que una ruptura del límite inferior 83699.27 fomente una continuación
Los marcos de tiempo M5 y M15 pueden tener más puntos de entrada falsos.
Open chart in a new window
Rectángulo Alcista
was formed on 17.04 at 21:47:00 (UTC+0)
signal strength 2 of 5
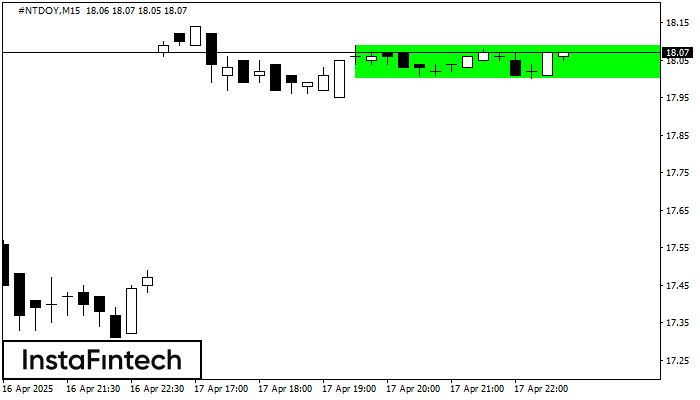
Según el gráfico de M15, #NTDOY formó el Rectángulo Alcista. El patrón indica la continuación de una tendencia. El límite superior es 18.09, el límite inferior es 18.00. La señal
Los marcos de tiempo M5 y M15 pueden tener más puntos de entrada falsos.
Open chart in a new window
Rectángulo Alcista
was formed on 17.04 at 21:45:00 (UTC+0)
signal strength 1 of 5
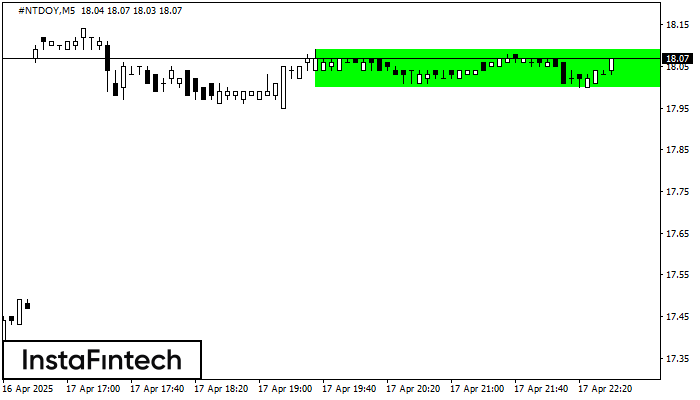
Según el gráfico de M5, #NTDOY formó el Rectángulo Alcista. El patrón indica la continuación de una tendencia. El límite superior es 18.09, el límite inferior es 18.00. La señal
Los marcos de tiempo M5 y M15 pueden tener más puntos de entrada falsos.
Open chart in a new window


