

Actual patterns

Patterns are graphical models which are formed in the chart by the price. According to one of the technical analysis postulates, history (price movement) repeats itself. It means that the price movements are often similar in the same situations which makes it possible to predict the further development of the situation with a high probability.
Relevant patterns by InstaTrade is an easy-to-use service which allows you to be aware of latest changes in the market and react to clues from the market in time. In our service you will always find the latest and most relevant patterns on any pair and any timeframe.
Bearish Symmetrical Triangle
was formed on 31.03 at 02:07:36 (UTC+0)
signal strength 1 of 5
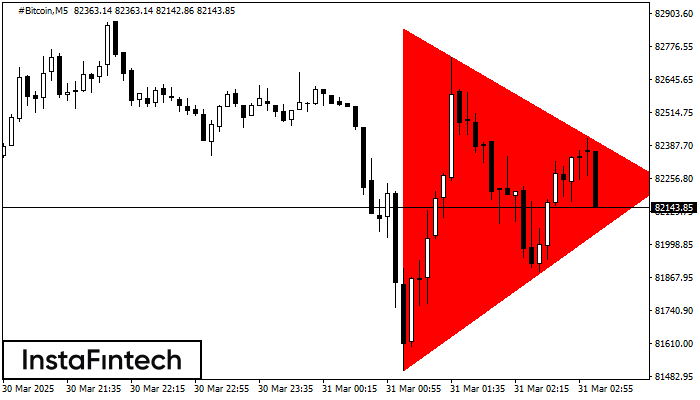
According to the chart of M5, #Bitcoin formed the Bearish Symmetrical Triangle pattern. Description: The lower border is 81505.64/82241.48 and upper border is 82843.91/82241.48. The pattern width is measured on the chart at -133827 pips. The formation of the Bearish Symmetrical Triangle pattern evidently signals a continuation of the downward trend. In other words, if the scenario comes true and #Bitcoin breaches the lower border, the price could continue its move toward 82241.33.
The M5 and M15 time frames may have more false entry points.
See Also
- All
- All
- Bearish Rectangle
- Bearish Symmetrical Triangle
- Bearish Symmetrical Triangle
- Bullish Rectangle
- Double Top
- Double Top
- Triple Bottom
- Triple Bottom
- Triple Top
- Triple Top
- All
- All
- Buy
- Sale
- All
- 1
- 2
- 3
- 4
- 5
Двойное дно
сформирован 08.06 в 10:06:13 (UTC+0)
сила сигнала 1 из 5

Сформирована фигура «Двойное дно» на графике #Bitcoin M5. Характеристика: Уровень поддержки 105358.42; Уровень сопротивления 105551.46; Ширина фигуры 19304 пунктов. В случае пробоя уровня сопротивления можно будет прогнозировать изменение тенденции
Таймфреймы М5 и М15 могут иметь больше ложных точек входа.
Открыть график инструмента в новом окне
Двойное дно
сформирован 08.06 в 05:35:30 (UTC+0)
сила сигнала 1 из 5

Сформирована фигура «Двойное дно» на графике #Bitcoin M5. Характеристика: Уровень поддержки 105347.39; Уровень сопротивления 105744.30; Ширина фигуры 39691 пунктов. В случае пробоя уровня сопротивления можно будет прогнозировать изменение тенденции
Таймфреймы М5 и М15 могут иметь больше ложных точек входа.
Открыть график инструмента в новом окне
Тройная вершина
сформирован 08.06 в 01:30:12 (UTC+0)
сила сигнала 2 из 5

На графике #Bitcoin M15 образовалась фигура «Тройная вершина», которая сигнализирует об изменении тенденции. Возможный сценарий: После формирования третьей вершины котировка постарается пробить нижнюю границу 105606.00, где трейдеру и стоило
Таймфреймы М5 и М15 могут иметь больше ложных точек входа.
Открыть график инструмента в новом окне


