

অ্যাকচুয়াল প্যাটার্নস

প্যাটার্ন হলো গ্রাফিক্যাল মডেল, যা মূল্য ওঠানামার ভিত্তিতে চার্টে তৈরি হয়। টেকনিক্যাল বিশ্লেষণের নীতি অনুযায়ী, ইতিহাসের (প্রাইস মুভমেন্ট) পুনরাবৃত্তি ঘটে। অর্থাৎ, পরিস্থিতি যদি একই রকম থাকে তাহলে প্রাইস মুভমেন্টও প্রায় একই রকম হয়। এর ফলে মূল্যের ওঠানামা কেমন হবে তা আগেই থেকেই অনুমান করা যায়।
ইন্সটাফরেক্স এর প্রাসঙ্গিক প্যাটার্নসমূহ সহজেই ব্যবহার করা যায়, যার মাধ্যমে মার্কেটের সর্বশেষ পরিস্থিতি জানা যায় এবং তার উপর ভিত্তি করে সিদ্ধান্ত নেওয়া যায়। আমাদের সেবাগুলো থেকে আপনি যেকোনো পেয়ার এবং টাইমফ্রেমের জন্য সর্বশেষ এবং সবচেয়ে প্রাসঙ্গিক প্যাটার্নগুলো খুঁজে পাবেন।
Double Bottom
was formed on 21.04 at 10:30:12 (UTC+0)
signal strength 2 of 5

The Double Bottom pattern has been formed on USDCAD M15; the upper boundary is 1.3801; the lower boundary is 1.3791. The width of the pattern is 11 points. In case of a break of the upper boundary 1.3801, a change in the trend can be predicted where the width of the pattern will coincide with the distance to a possible take profit level.
The M5 and M15 time frames may have more false entry points.
- All
- All
- Bearish Rectangle
- Bearish Symmetrical Triangle
- Bearish Symmetrical Triangle
- Bullish Rectangle
- Double Top
- Double Top
- Triple Bottom
- Triple Bottom
- Triple Top
- Triple Top
- All
- All
- Buy
- Sale
- All
- 1
- 2
- 3
- 4
- 5
Double Bottom
was formed on 07.05 at 01:00:48 (UTC+0)
signal strength 4 of 5
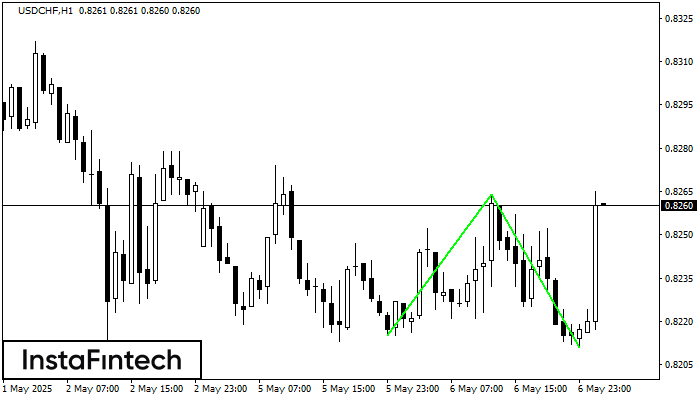
The Double Bottom pattern has been formed on USDCHF H1; the upper boundary is 0.8264; the lower boundary is 0.8211. The width of the pattern is 49 points. In case
Open chart in a new window
Double Bottom
was formed on 07.05 at 01:00:39 (UTC+0)
signal strength 4 of 5
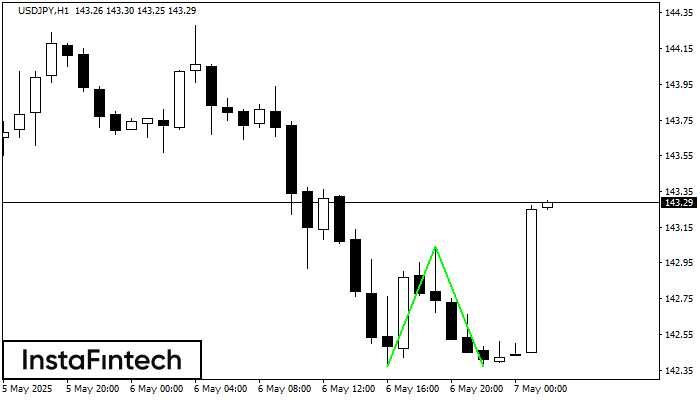
The Double Bottom pattern has been formed on USDJPY H1. Characteristics: the support level 142.37; the resistance level 143.04; the width of the pattern 67 points. If the resistance level
Open chart in a new window
Triple Top
was formed on 07.05 at 01:00:22 (UTC+0)
signal strength 4 of 5
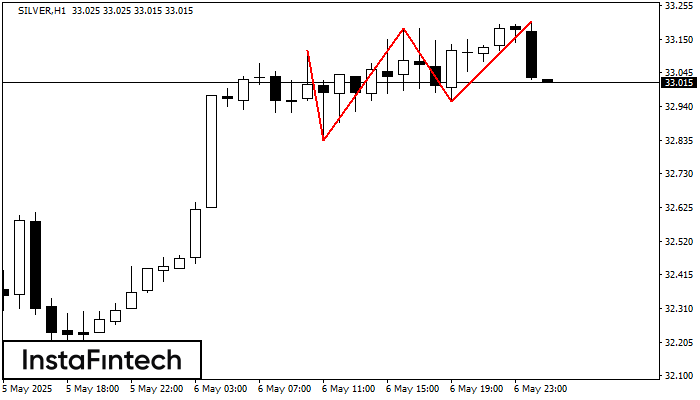
The Triple Top pattern has formed on the chart of the SILVER H1. Features of the pattern: borders have an ascending angle; the lower line of the pattern
Open chart in a new window


