

অ্যাকচুয়াল প্যাটার্নস

প্যাটার্ন হলো গ্রাফিক্যাল মডেল, যা মূল্য ওঠানামার ভিত্তিতে চার্টে তৈরি হয়। টেকনিক্যাল বিশ্লেষণের নীতি অনুযায়ী, ইতিহাসের (প্রাইস মুভমেন্ট) পুনরাবৃত্তি ঘটে। অর্থাৎ, পরিস্থিতি যদি একই রকম থাকে তাহলে প্রাইস মুভমেন্টও প্রায় একই রকম হয়। এর ফলে মূল্যের ওঠানামা কেমন হবে তা আগেই থেকেই অনুমান করা যায়।
ইন্সটাফরেক্স এর প্রাসঙ্গিক প্যাটার্নসমূহ সহজেই ব্যবহার করা যায়, যার মাধ্যমে মার্কেটের সর্বশেষ পরিস্থিতি জানা যায় এবং তার উপর ভিত্তি করে সিদ্ধান্ত নেওয়া যায়। আমাদের সেবাগুলো থেকে আপনি যেকোনো পেয়ার এবং টাইমফ্রেমের জন্য সর্বশেষ এবং সবচেয়ে প্রাসঙ্গিক প্যাটার্নগুলো খুঁজে পাবেন।
Bullish Rectangle
was formed on 19.04 at 17:03:40 (UTC+0)
signal strength 1 of 5

According to the chart of M5, #Bitcoin formed the Bullish Rectangle. This type of a pattern indicates a trend continuation. It consists of two levels: resistance 85457.12 and support 85308.07. In case the resistance level 85457.12 - 85457.12 is broken, the instrument is likely to follow the bullish trend.
The M5 and M15 time frames may have more false entry points.
- All
- All
- Bearish Rectangle
- Bearish Symmetrical Triangle
- Bearish Symmetrical Triangle
- Bullish Rectangle
- Double Top
- Double Top
- Triple Bottom
- Triple Bottom
- Triple Top
- Triple Top
- All
- All
- Buy
- Sale
- All
- 1
- 2
- 3
- 4
- 5
बुलिश सिमेट्रिकल त्रिभुज
was formed on 05.05 at 04:00:41 (UTC+0)
signal strength 4 of 5
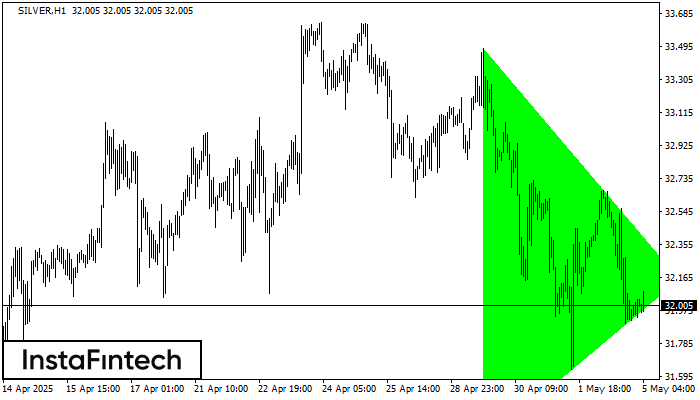
H1 के चार्ट के अनुसार, SILVER से बुलिश सिमेट्रिकल त्रिभुज पैटर्न बना, जो दर्शाता है कि ट्रेंड जारी रहेगा। विवरण: पैटर्न की ऊपरी सीमा निर्देशांक 33.48/32.16 को स्पर्श करती है
Open chart in a new window
बियरिश पताका
was formed on 05.05 at 03:42:46 (UTC+0)
signal strength 1 of 5
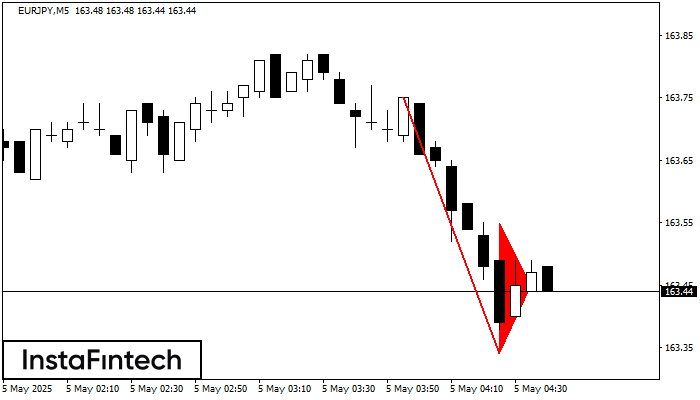
बियरिश पताका पैटर्न EURJPY M5 चार्ट पर बना है। यह मौजूदा ट्रेंड कि संभावित निरंतरता का संकेत देता है। निर्दिष्टीकरण: पैटर्न का नीचल स्तर 163.34 पर है; फ्लैगपोल की ऊंचाई
M5 और M15 समय सीमा में अधिक फाल्स एंट्री पॉइंट्स हो सकते हैं।
Open chart in a new window
डबल बॉटम
was formed on 05.05 at 02:45:03 (UTC+0)
signal strength 1 of 5
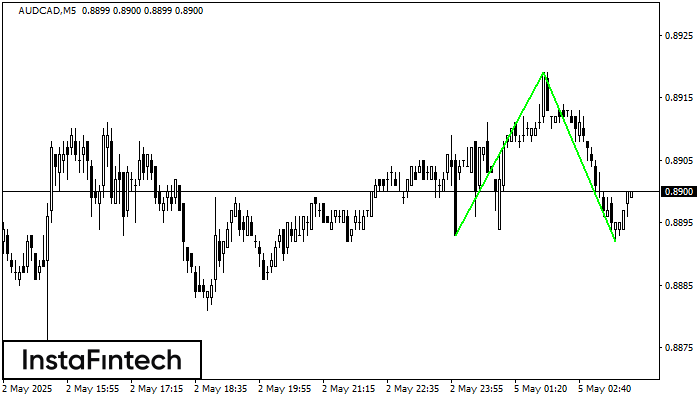
डबल बॉटम पैटर्न AUDCAD M5 पर बना है। यह फॉर्मेशन नीचे से ऊपर की ओर प्रवृत्ति के उलट होने का संकेत देता है। संकेत यह है कि पैटर्न 0.8919 की
M5 और M15 समय सीमा में अधिक फाल्स एंट्री पॉइंट्स हो सकते हैं।
Open chart in a new window


