

অ্যাকচুয়াল প্যাটার্নস

প্যাটার্ন হলো গ্রাফিক্যাল মডেল, যা মূল্য ওঠানামার ভিত্তিতে চার্টে তৈরি হয়। টেকনিক্যাল বিশ্লেষণের নীতি অনুযায়ী, ইতিহাসের (প্রাইস মুভমেন্ট) পুনরাবৃত্তি ঘটে। অর্থাৎ, পরিস্থিতি যদি একই রকম থাকে তাহলে প্রাইস মুভমেন্টও প্রায় একই রকম হয়। এর ফলে মূল্যের ওঠানামা কেমন হবে তা আগেই থেকেই অনুমান করা যায়।
ইন্সটাফরেক্স এর প্রাসঙ্গিক প্যাটার্নসমূহ সহজেই ব্যবহার করা যায়, যার মাধ্যমে মার্কেটের সর্বশেষ পরিস্থিতি জানা যায় এবং তার উপর ভিত্তি করে সিদ্ধান্ত নেওয়া যায়। আমাদের সেবাগুলো থেকে আপনি যেকোনো পেয়ার এবং টাইমফ্রেমের জন্য সর্বশেষ এবং সবচেয়ে প্রাসঙ্গিক প্যাটার্নগুলো খুঁজে পাবেন।
Triple Bottom
was formed on 14.04 at 20:56:31 (UTC+0)
signal strength 1 of 5
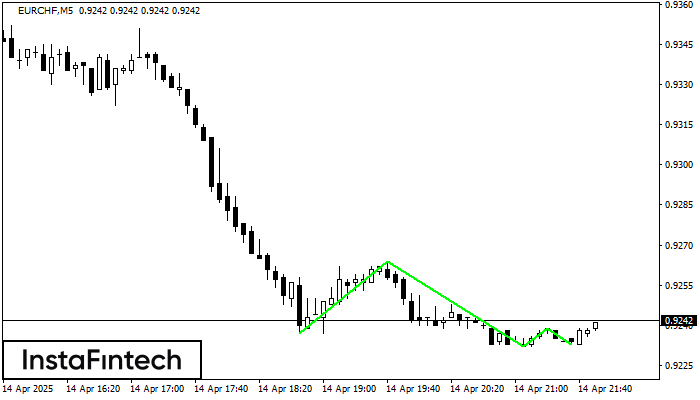
The Triple Bottom pattern has been formed on EURCHF M5. It has the following characteristics: resistance level 0.9264/0.9239; support level 0.9237/0.9233; the width is 27 points. In the event of a breakdown of the resistance level of 0.9264, the price is likely to continue an upward movement at least to 0.9247.
The M5 and M15 time frames may have more false entry points.
- All
- All
- Bearish Rectangle
- Bearish Symmetrical Triangle
- Bearish Symmetrical Triangle
- Bullish Rectangle
- Double Top
- Double Top
- Triple Bottom
- Triple Bottom
- Triple Top
- Triple Top
- All
- All
- Buy
- Sale
- All
- 1
- 2
- 3
- 4
- 5
Triple Bottom
was formed on 09.05 at 01:00:28 (UTC+0)
signal strength 4 of 5
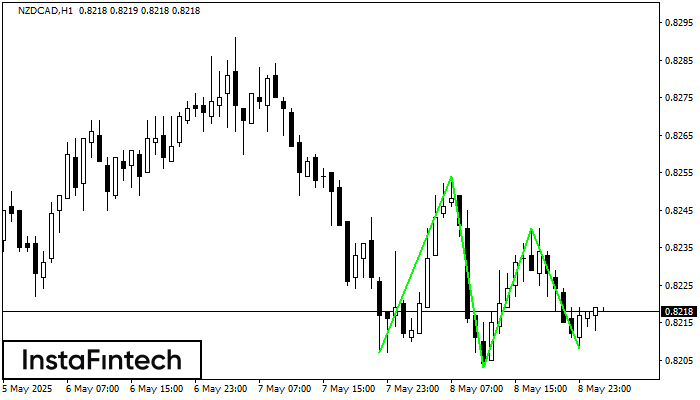
The Triple Bottom pattern has formed on the chart of NZDCAD H1. Features of the pattern: The lower line of the pattern has coordinates 0.8254 with the upper limit 0.8254/0.8240
Open chart in a new window
Double Top
was formed on 09.05 at 00:59:57 (UTC+0)
signal strength 3 of 5
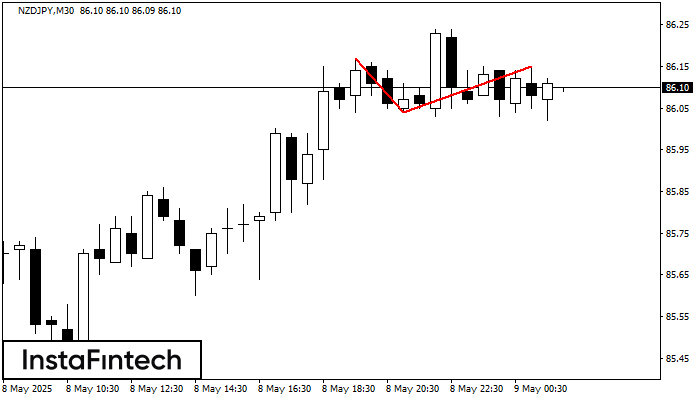
The Double Top reversal pattern has been formed on NZDJPY M30. Characteristics: the upper boundary 86.17; the lower boundary 86.04; the width of the pattern is 11 points. Sell trades
Open chart in a new window
Inverse Head and Shoulder
was formed on 09.05 at 00:46:04 (UTC+0)
signal strength 1 of 5
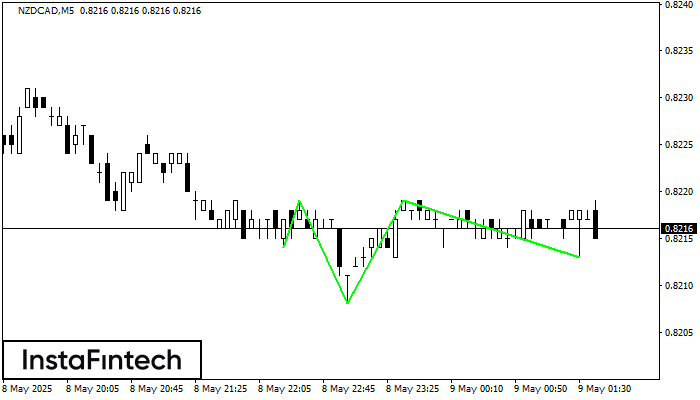
According to the chart of M5, NZDCAD formed the Inverse Head and Shoulder pattern. The Head’s top is set at 0.8219 while the median line of the Neck is found
The M5 and M15 time frames may have more false entry points.
Open chart in a new window


