

অ্যাকচুয়াল প্যাটার্নস

প্যাটার্ন হলো গ্রাফিক্যাল মডেল, যা মূল্য ওঠানামার ভিত্তিতে চার্টে তৈরি হয়। টেকনিক্যাল বিশ্লেষণের নীতি অনুযায়ী, ইতিহাসের (প্রাইস মুভমেন্ট) পুনরাবৃত্তি ঘটে। অর্থাৎ, পরিস্থিতি যদি একই রকম থাকে তাহলে প্রাইস মুভমেন্টও প্রায় একই রকম হয়। এর ফলে মূল্যের ওঠানামা কেমন হবে তা আগেই থেকেই অনুমান করা যায়।
ইন্সটাফরেক্স এর প্রাসঙ্গিক প্যাটার্নসমূহ সহজেই ব্যবহার করা যায়, যার মাধ্যমে মার্কেটের সর্বশেষ পরিস্থিতি জানা যায় এবং তার উপর ভিত্তি করে সিদ্ধান্ত নেওয়া যায়। আমাদের সেবাগুলো থেকে আপনি যেকোনো পেয়ার এবং টাইমফ্রেমের জন্য সর্বশেষ এবং সবচেয়ে প্রাসঙ্গিক প্যাটার্নগুলো খুঁজে পাবেন।
Triple Top
was formed on 14.04 at 18:00:31 (UTC+0)
signal strength 3 of 5
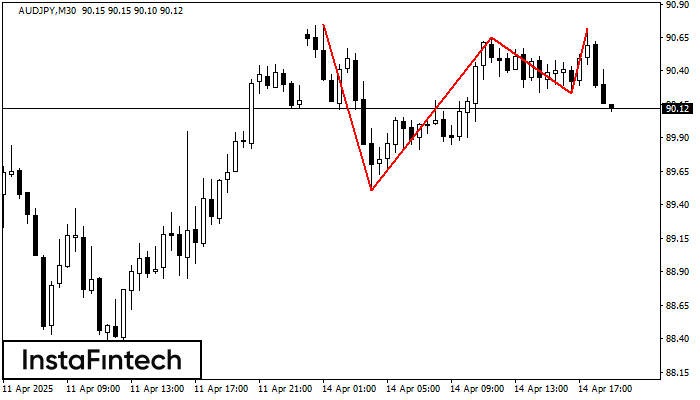
On the chart of the AUDJPY M30 trading instrument, the Triple Top pattern that signals a trend change has formed. It is possible that after formation of the third peak, the price will try to break through the resistance level 89.51, where we advise to open a trading position for sale. Take profit is the projection of the pattern’s width, which is 124 points.
- All
- All
- Bearish Rectangle
- Bearish Symmetrical Triangle
- Bearish Symmetrical Triangle
- Bullish Rectangle
- Double Top
- Double Top
- Triple Bottom
- Triple Bottom
- Triple Top
- Triple Top
- All
- All
- Buy
- Sale
- All
- 1
- 2
- 3
- 4
- 5
Bawah Triple
was formed on 08.05 at 12:20:35 (UTC+0)
signal strength 1 of 5

Pola Bawah Triple telah terbentuk pada grafik GBPCHF M5. Fitur-fitur pola: garis bawah pola memiliki koordinat 1.0970 dengan batas atas 1.0970/1.0964, proyeksi lebar adalah 14 poin. Pembentukan pola Bawah Triple
Rangka waktu M5 dan M15 mungkin memiliki lebih dari titik entri yang keliru.
Open chart in a new window
Bendera Bullish
was formed on 08.05 at 12:10:56 (UTC+0)
signal strength 2 of 5

Pola Bendera Bullish telah terbentuk di EURJPY at M15. Batas bawah pola ini terletak di 163.36/163.14, sementara batas atas terletak di 163.60/163.38. Proyeksi panjang jarum candle 62 poin. Pembentukan
Rangka waktu M5 dan M15 mungkin memiliki lebih dari titik entri yang keliru.
Open chart in a new window
Panji Bullish
was formed on 08.05 at 12:10:51 (UTC+0)
signal strength 2 of 5
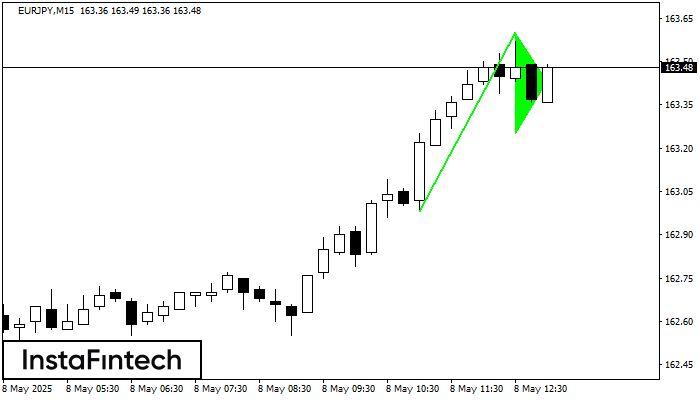
Pola grafik Panji Bullish telah terbentuk di instrumen EURJPY M15. Jenis pola ini terjadi pada kategori pola kelanjutan. Dalam kasus ini, jika kuotasi dapat menembus titik tertinggi, harga diperkirakan akan
Rangka waktu M5 dan M15 mungkin memiliki lebih dari titik entri yang keliru.
Open chart in a new window


