

অ্যাকচুয়াল প্যাটার্নস

প্যাটার্ন হলো গ্রাফিক্যাল মডেল, যা মূল্য ওঠানামার ভিত্তিতে চার্টে তৈরি হয়। টেকনিক্যাল বিশ্লেষণের নীতি অনুযায়ী, ইতিহাসের (প্রাইস মুভমেন্ট) পুনরাবৃত্তি ঘটে। অর্থাৎ, পরিস্থিতি যদি একই রকম থাকে তাহলে প্রাইস মুভমেন্টও প্রায় একই রকম হয়। এর ফলে মূল্যের ওঠানামা কেমন হবে তা আগেই থেকেই অনুমান করা যায়।
ইন্সটাফরেক্স এর প্রাসঙ্গিক প্যাটার্নসমূহ সহজেই ব্যবহার করা যায়, যার মাধ্যমে মার্কেটের সর্বশেষ পরিস্থিতি জানা যায় এবং তার উপর ভিত্তি করে সিদ্ধান্ত নেওয়া যায়। আমাদের সেবাগুলো থেকে আপনি যেকোনো পেয়ার এবং টাইমফ্রেমের জন্য সর্বশেষ এবং সবচেয়ে প্রাসঙ্গিক প্যাটার্নগুলো খুঁজে পাবেন।
Bullish Symmetrical Triangle
was formed on 14.04 at 12:56:06 (UTC+0)
signal strength 1 of 5

According to the chart of M5, NZDJPY formed the Bullish Symmetrical Triangle pattern. Description: This is the pattern of a trend continuation. 84.17 and 83.88 are the coordinates of the upper and lower borders respectively. The pattern width is measured on the chart at 29 pips. Outlook: If the upper border 84.17 is broken, the price is likely to continue its move by 84.15.
The M5 and M15 time frames may have more false entry points.
আরও দেখুন
- All
- All
- Bearish Rectangle
- Bearish Symmetrical Triangle
- Bearish Symmetrical Triangle
- Bullish Rectangle
- Double Top
- Double Top
- Triple Bottom
- Triple Bottom
- Triple Top
- Triple Top
- All
- All
- Buy
- Sale
- All
- 1
- 2
- 3
- 4
- 5
ইনভার্স হেড অ্যান্ড শোল্ডার্স
was formed on 08.05 at 11:55:15 (UTC+0)
signal strength 1 of 5
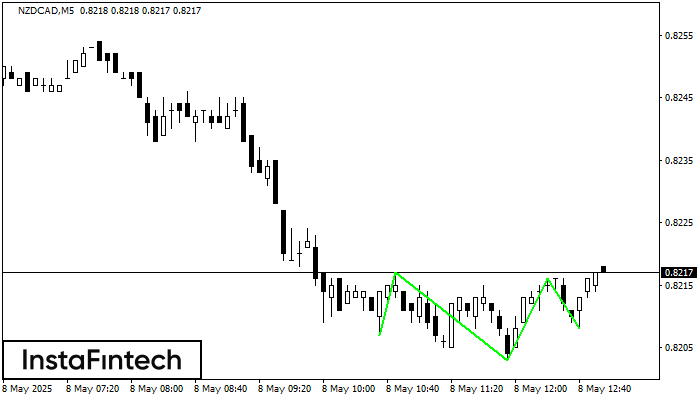
M5 চার্ট অনুসারে, NZDCAD-এর ইনভার্স হেড অ্যান্ড শোল্ডার্স টেকনিক্যাল প্যাটার্ন গঠিত হচ্ছে৷ যদি 0.8217/0.8216-এর নেকলাইন ব্রেক করা হয়, তাহলে ইন্সট্রুমেন্টটি 0.8231-এর দিকে যেতে পারে।
M5 এবং M15 টাইম ফ্রেমে আরও ভুল এন্ট্রি পয়েন্ট থাকতে পারে।
Open chart in a new window
ট্রিপল বটম
was formed on 08.05 at 11:11:41 (UTC+0)
signal strength 1 of 5
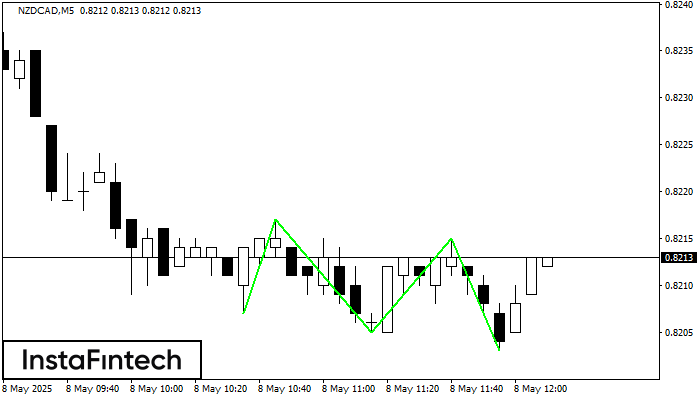
M5 চার্টে NZDCAD-এর ট্রিপল বটম প্যাটার্নটি গঠিত হয়েছে। প্যাটার্নের বৈশিষ্ট্য: প্যাটার্নের নীচের লাইনে কোঅর্ডিনেট 0.8217 রয়েছে এবং এটির উপরের সীমা 0.8217/0.8215, প্রস্থের প্রজেকশন হল 10 পয়েন্ট। ট্রিপল বটম প্যাটার্নের
M5 এবং M15 টাইম ফ্রেমে আরও ভুল এন্ট্রি পয়েন্ট থাকতে পারে।
Open chart in a new window
বিয়ারিশ সিমেট্রিক্যাল ট্রায়াঙ্গেল
was formed on 08.05 at 11:01:57 (UTC+0)
signal strength 2 of 5
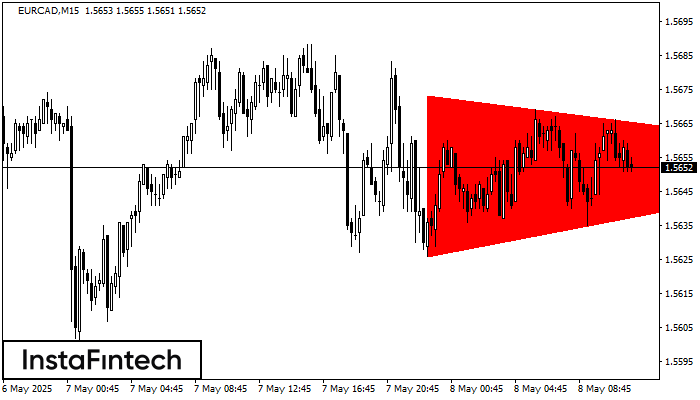
M15 চার্ট অনুযায়ী, EURCAD বিয়ারিশ সিমেট্রিক্যাল ট্রায়াঙ্গেল প্যাটার্ন গঠন করেছে। 1.5626 -এর নীচের সীমানা লঙ্ঘন করা হলে এই প্যাটার্নটি আরও নিম্নমুখী প্রবণতার সংকেত প্রদান করে। এখানে, সম্ভাব্য মুনাফা উপলব্ধ প্যাটার্নের
M5 এবং M15 টাইম ফ্রেমে আরও ভুল এন্ট্রি পয়েন্ট থাকতে পারে।
Open chart in a new window


