

অ্যাকচুয়াল প্যাটার্নস

প্যাটার্ন হলো গ্রাফিক্যাল মডেল, যা মূল্য ওঠানামার ভিত্তিতে চার্টে তৈরি হয়। টেকনিক্যাল বিশ্লেষণের নীতি অনুযায়ী, ইতিহাসের (প্রাইস মুভমেন্ট) পুনরাবৃত্তি ঘটে। অর্থাৎ, পরিস্থিতি যদি একই রকম থাকে তাহলে প্রাইস মুভমেন্টও প্রায় একই রকম হয়। এর ফলে মূল্যের ওঠানামা কেমন হবে তা আগেই থেকেই অনুমান করা যায়।
ইন্সটাফরেক্স এর প্রাসঙ্গিক প্যাটার্নসমূহ সহজেই ব্যবহার করা যায়, যার মাধ্যমে মার্কেটের সর্বশেষ পরিস্থিতি জানা যায় এবং তার উপর ভিত্তি করে সিদ্ধান্ত নেওয়া যায়। আমাদের সেবাগুলো থেকে আপনি যেকোনো পেয়ার এবং টাইমফ্রেমের জন্য সর্বশেষ এবং সবচেয়ে প্রাসঙ্গিক প্যাটার্নগুলো খুঁজে পাবেন।
Bearish pennant
was formed on 07.04 at 00:30:13 (UTC+0)
signal strength 3 of 5
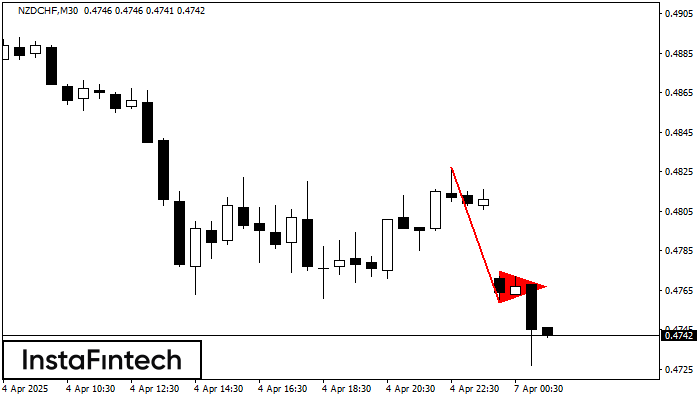
The Bearish pennant pattern has formed on the NZDCHF M30 chart. It signals potential continuation of the existing trend. Specifications: the pattern’s bottom has the coordinate of 0.4759; the projection of the flagpole height is equal to 68 pips. In case the price breaks out the pattern’s bottom of 0.4759, the downtrend is expected to continue for further level 0.4729.
- All
- All
- Bearish Rectangle
- Bearish Symmetrical Triangle
- Bearish Symmetrical Triangle
- Bullish Rectangle
- Double Top
- Double Top
- Triple Bottom
- Triple Bottom
- Triple Top
- Triple Top
- All
- All
- Buy
- Sale
- All
- 1
- 2
- 3
- 4
- 5
Persegi Bullish
was formed on 07.05 at 16:01:30 (UTC+0)
signal strength 4 of 5
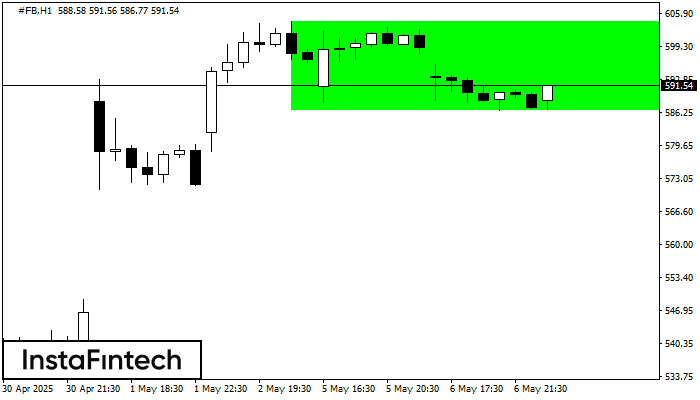
Menurut grafik dari H1, #FB terbentuk Persegi Bullish. Pola menunjukkan kelanjutan tren. Batas atas adalah 604.25, batas lebih rendah adalah 586.62. Sinyal berarti posisi beli harus dibuka diatas batas atas
Open chart in a new window
Panji Bullish
was formed on 07.05 at 16:01:24 (UTC+0)
signal strength 2 of 5
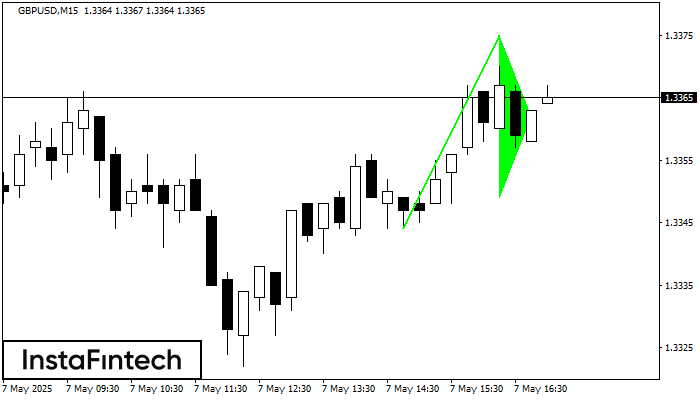
Sinyal Panji Bullish – instrumen trading GBPUSD M15, pola kelanjutan. Prakiraan: mungkin untuk mengatur posisi beli di atas titik tertinggi pola, di 1.3375, dengan prospek pergerakan selanjutnya menjadi proyeksi titik
Rangka waktu M5 dan M15 mungkin memiliki lebih dari titik entri yang keliru.
Open chart in a new window
Teratas Ganda
was formed on 07.05 at 15:59:46 (UTC+0)
signal strength 3 of 5
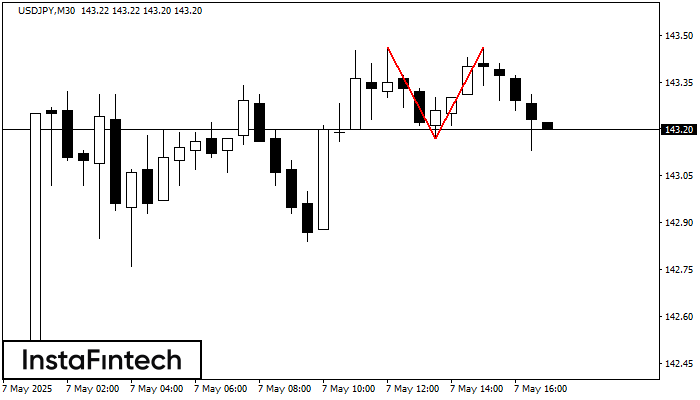
Pada grafik USDJPY M30 pola reversal Teratas Ganda telah terbentuk. Karakteristik: batas atas 143.46; batas bawah 143.17; lebar pola 29 poin. Sinyal: tembusan ke batas bawah akan menyebabkan kelanjutan tren
Open chart in a new window


