

অ্যাকচুয়াল প্যাটার্নস

প্যাটার্ন হলো গ্রাফিক্যাল মডেল, যা মূল্য ওঠানামার ভিত্তিতে চার্টে তৈরি হয়। টেকনিক্যাল বিশ্লেষণের নীতি অনুযায়ী, ইতিহাসের (প্রাইস মুভমেন্ট) পুনরাবৃত্তি ঘটে। অর্থাৎ, পরিস্থিতি যদি একই রকম থাকে তাহলে প্রাইস মুভমেন্টও প্রায় একই রকম হয়। এর ফলে মূল্যের ওঠানামা কেমন হবে তা আগেই থেকেই অনুমান করা যায়।
ইন্সটাফরেক্স এর প্রাসঙ্গিক প্যাটার্নসমূহ সহজেই ব্যবহার করা যায়, যার মাধ্যমে মার্কেটের সর্বশেষ পরিস্থিতি জানা যায় এবং তার উপর ভিত্তি করে সিদ্ধান্ত নেওয়া যায়। আমাদের সেবাগুলো থেকে আপনি যেকোনো পেয়ার এবং টাইমফ্রেমের জন্য সর্বশেষ এবং সবচেয়ে প্রাসঙ্গিক প্যাটার্নগুলো খুঁজে পাবেন।
Triple Bottom
was formed on 04.04 at 01:30:32 (UTC+0)
signal strength 2 of 5
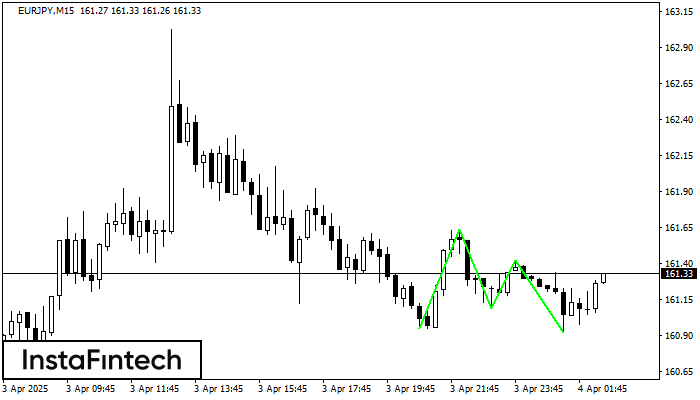
The Triple Bottom pattern has formed on the chart of EURJPY M15. Features of the pattern: The lower line of the pattern has coordinates 161.64 with the upper limit 161.64/161.42, the projection of the width is 69 points. The formation of the Triple Bottom pattern most likely indicates a change in the trend from downward to upward. This means that in the event of a breakdown of the resistance level 160.95, the price is most likely to continue the upward movement.
The M5 and M15 time frames may have more false entry points.
- All
- All
- Bearish Rectangle
- Bearish Symmetrical Triangle
- Bearish Symmetrical Triangle
- Bullish Rectangle
- Double Top
- Double Top
- Triple Bottom
- Triple Bottom
- Triple Top
- Triple Top
- All
- All
- Buy
- Sale
- All
- 1
- 2
- 3
- 4
- 5
Double Top
was formed on 14.05 at 22:00:08 (UTC+0)
signal strength 2 of 5
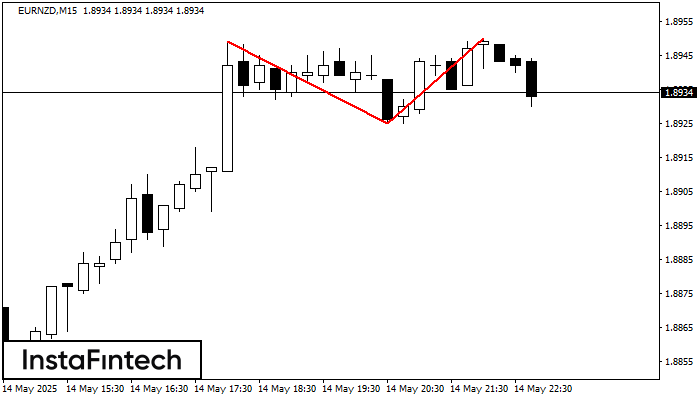
On the chart of EURNZD M15 the Double Top reversal pattern has been formed. Characteristics: the upper boundary 1.8950; the lower boundary 1.8925; the width of the pattern 25 points
The M5 and M15 time frames may have more false entry points.
Open chart in a new window
Double Bottom
was formed on 14.05 at 21:50:08 (UTC+0)
signal strength 1 of 5
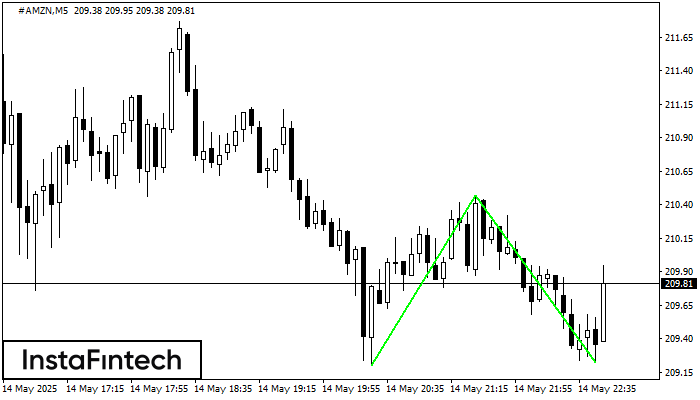
The Double Bottom pattern has been formed on #AMZN M5; the upper boundary is 210.47; the lower boundary is 209.22. The width of the pattern is 127 points. In case
The M5 and M15 time frames may have more false entry points.
Open chart in a new window
Bearish Flag
was formed on 14.05 at 21:48:16 (UTC+0)
signal strength 4 of 5
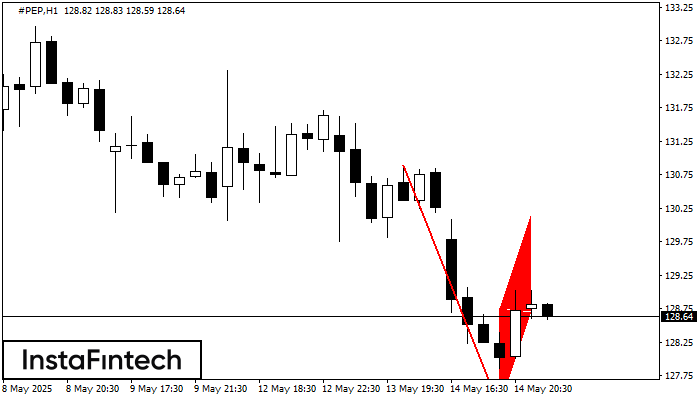
The Bearish Flag pattern has been formed on #PEP at H1. The lower boundary of the pattern is located at 127.29/128.71 while the upper boundary lies at 128.75/130.17. The projection
Open chart in a new window


