

অ্যাকচুয়াল প্যাটার্নস

প্যাটার্ন হলো গ্রাফিক্যাল মডেল, যা মূল্য ওঠানামার ভিত্তিতে চার্টে তৈরি হয়। টেকনিক্যাল বিশ্লেষণের নীতি অনুযায়ী, ইতিহাসের (প্রাইস মুভমেন্ট) পুনরাবৃত্তি ঘটে। অর্থাৎ, পরিস্থিতি যদি একই রকম থাকে তাহলে প্রাইস মুভমেন্টও প্রায় একই রকম হয়। এর ফলে মূল্যের ওঠানামা কেমন হবে তা আগেই থেকেই অনুমান করা যায়।
ইন্সটাফরেক্স এর প্রাসঙ্গিক প্যাটার্নসমূহ সহজেই ব্যবহার করা যায়, যার মাধ্যমে মার্কেটের সর্বশেষ পরিস্থিতি জানা যায় এবং তার উপর ভিত্তি করে সিদ্ধান্ত নেওয়া যায়। আমাদের সেবাগুলো থেকে আপনি যেকোনো পেয়ার এবং টাইমফ্রেমের জন্য সর্বশেষ এবং সবচেয়ে প্রাসঙ্গিক প্যাটার্নগুলো খুঁজে পাবেন।
Double Bottom
was formed on 03.04 at 16:59:49 (UTC+0)
signal strength 2 of 5
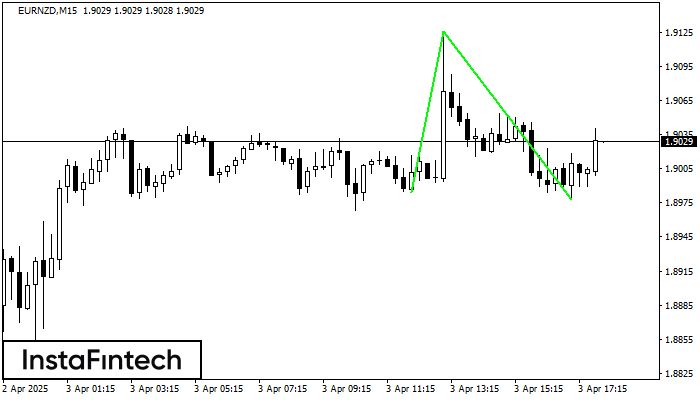
The Double Bottom pattern has been formed on EURNZD M15. Characteristics: the support level 1.8984; the resistance level 1.9126; the width of the pattern 142 points. If the resistance level is broken, a change in the trend can be predicted with the first target point lying at the distance of 148 points.
The M5 and M15 time frames may have more false entry points.
আরও দেখুন
- All
- All
- Bearish Rectangle
- Bearish Symmetrical Triangle
- Bearish Symmetrical Triangle
- Bullish Rectangle
- Double Top
- Double Top
- Triple Bottom
- Triple Bottom
- Triple Top
- Triple Top
- All
- All
- Buy
- Sale
- All
- 1
- 2
- 3
- 4
- 5
Topo duplo
was formed on 22.05 at 18:35:37 (UTC+0)
signal strength 1 of 5
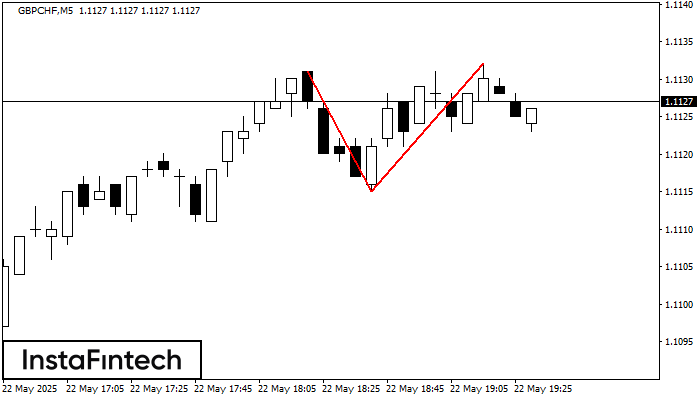
No gráfico de GBPCHF M5 o padrão de reversão Topo duplo foi formado. Características: o limite superior 1.1132; o limite inferior 1.1115; a largura do padrão 17 pontos. O sinal
Os intervalos M5 e M15 podem ter mais pontos de entrada falsos.
Open chart in a new window
Fundo duplo
was formed on 22.05 at 18:30:19 (UTC+0)
signal strength 3 of 5
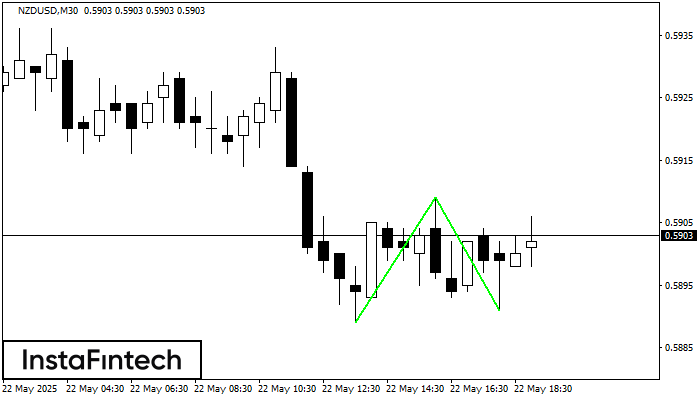
O padrão Fundo duplo foi formado em NZDUSD M30. Esta formação sinaliza uma reversão da tendência de baixo para cima. O sinal é que uma negociação de compra deve
Open chart in a new window
Fundo duplo
was formed on 22.05 at 18:15:26 (UTC+0)
signal strength 1 of 5
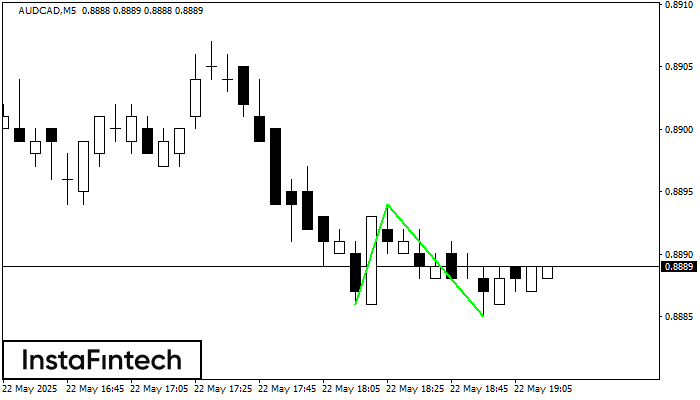
O padrão Fundo duplo foi formado em AUDCAD M5; o limite superior é 0.8894; o limite inferior é 0.8885. A largura do padrão é de 8 pontos. No caso
Os intervalos M5 e M15 podem ter mais pontos de entrada falsos.
Open chart in a new window


