

অ্যাকচুয়াল প্যাটার্নস

প্যাটার্ন হলো গ্রাফিক্যাল মডেল, যা মূল্য ওঠানামার ভিত্তিতে চার্টে তৈরি হয়। টেকনিক্যাল বিশ্লেষণের নীতি অনুযায়ী, ইতিহাসের (প্রাইস মুভমেন্ট) পুনরাবৃত্তি ঘটে। অর্থাৎ, পরিস্থিতি যদি একই রকম থাকে তাহলে প্রাইস মুভমেন্টও প্রায় একই রকম হয়। এর ফলে মূল্যের ওঠানামা কেমন হবে তা আগেই থেকেই অনুমান করা যায়।
ইন্সটাফরেক্স এর প্রাসঙ্গিক প্যাটার্নসমূহ সহজেই ব্যবহার করা যায়, যার মাধ্যমে মার্কেটের সর্বশেষ পরিস্থিতি জানা যায় এবং তার উপর ভিত্তি করে সিদ্ধান্ত নেওয়া যায়। আমাদের সেবাগুলো থেকে আপনি যেকোনো পেয়ার এবং টাইমফ্রেমের জন্য সর্বশেষ এবং সবচেয়ে প্রাসঙ্গিক প্যাটার্নগুলো খুঁজে পাবেন।
Triple Bottom
was formed on 02.04 at 13:40:27 (UTC+0)
signal strength 1 of 5
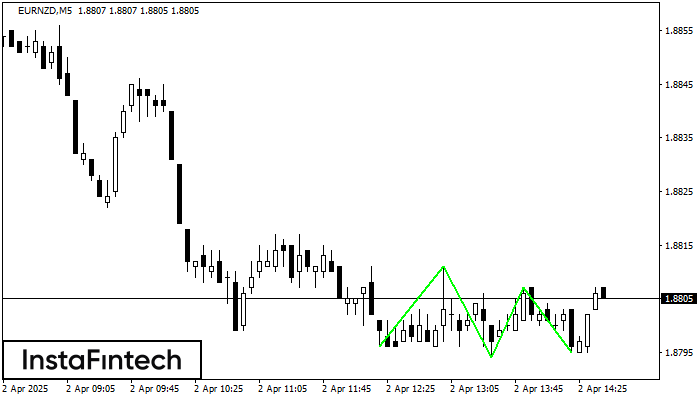
The Triple Bottom pattern has formed on the chart of EURNZD M5. Features of the pattern: The lower line of the pattern has coordinates 1.8811 with the upper limit 1.8811/1.8807, the projection of the width is 15 points. The formation of the Triple Bottom pattern most likely indicates a change in the trend from downward to upward. This means that in the event of a breakdown of the resistance level 1.8796, the price is most likely to continue the upward movement.
The M5 and M15 time frames may have more false entry points.
- All
- All
- Bearish Rectangle
- Bearish Symmetrical Triangle
- Bearish Symmetrical Triangle
- Bullish Rectangle
- Double Top
- Double Top
- Triple Bottom
- Triple Bottom
- Triple Top
- Triple Top
- All
- All
- Buy
- Sale
- All
- 1
- 2
- 3
- 4
- 5
รูปแบบกราฟจุดสองยอด (Double Top)
was formed on 06.05 at 16:45:22 (UTC+0)
signal strength 1 of 5
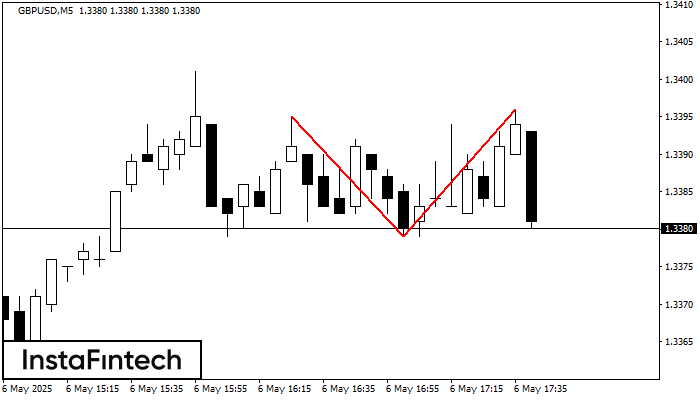
รูปแบบการย้อนตัว รูปแบบกราฟจุดสองยอด (Double Top) ได้ถูกสร้างขึ้นมาใน GBPUSD M5 คุณลักษณะ: ขอบเขตด้านบน 1.3395; ขอบเขตด้านล่าง 1.3379; ความกว้างของกราฟรูปแบบนี้คือ 17 จุด
ขอบเตระยะเวลาใน M5 และ M15 อาจจะมีตำแหน่งการเข้าใช้งานที่ผิดพลาดมากยิ่งขึ้น
Open chart in a new window
รูปแบบกราฟจุดสองยอด (Double Top)
was formed on 06.05 at 16:30:12 (UTC+0)
signal strength 1 of 5
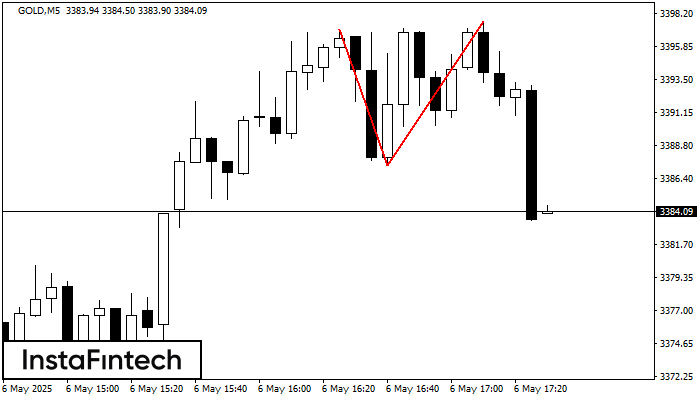
รูปแบบการย้อนตัว รูปแบบกราฟจุดสองยอด (Double Top) ได้ถูกสร้างขึ้นมาใน GOLD M5 คุณลักษณะ: ขอบเขตด้านบน 3397.08; ขอบเขตด้านล่าง 3387.33; ความกว้างของกราฟรูปแบบนี้คือ 1031 จุด
ขอบเตระยะเวลาใน M5 และ M15 อาจจะมีตำแหน่งการเข้าใช้งานที่ผิดพลาดมากยิ่งขึ้น
Open chart in a new window
รูปแบบกราฟหัวและหัวไหล่แบบกลับหัว (Inverse Head and Shoulder)
was formed on 06.05 at 16:00:15 (UTC+0)
signal strength 3 of 5
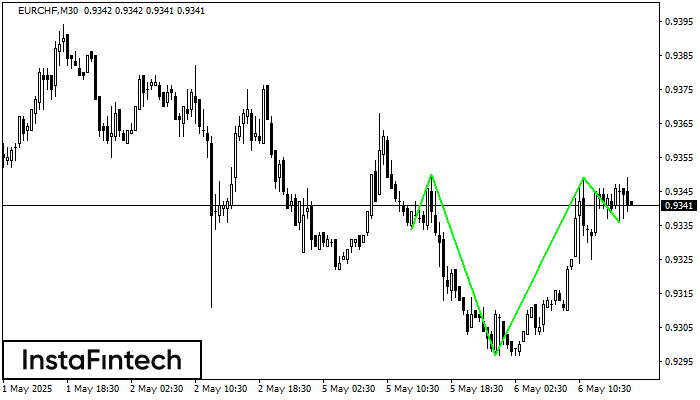
อ้างอิงจาก M30, EURCHF กำลังก่อรูปแบบทางเทคนิคขึ้นมา รูปแบบกราฟหัวและหัวไหล่แบบกลับหัว (Inverse Head and Shoulder) ในกรณีที่มีการเคลื่อนตัวทะลุผ่านตำแหน่งคอ 0.9350/0.9349 ออกไป ตราสารก็อาจจะเคลื่อนตัวไปยัง 0.9379
Open chart in a new window


