

অ্যাকচুয়াল প্যাটার্নস

প্যাটার্ন হলো গ্রাফিক্যাল মডেল, যা মূল্য ওঠানামার ভিত্তিতে চার্টে তৈরি হয়। টেকনিক্যাল বিশ্লেষণের নীতি অনুযায়ী, ইতিহাসের (প্রাইস মুভমেন্ট) পুনরাবৃত্তি ঘটে। অর্থাৎ, পরিস্থিতি যদি একই রকম থাকে তাহলে প্রাইস মুভমেন্টও প্রায় একই রকম হয়। এর ফলে মূল্যের ওঠানামা কেমন হবে তা আগেই থেকেই অনুমান করা যায়।
ইন্সটাফরেক্স এর প্রাসঙ্গিক প্যাটার্নসমূহ সহজেই ব্যবহার করা যায়, যার মাধ্যমে মার্কেটের সর্বশেষ পরিস্থিতি জানা যায় এবং তার উপর ভিত্তি করে সিদ্ধান্ত নেওয়া যায়। আমাদের সেবাগুলো থেকে আপনি যেকোনো পেয়ার এবং টাইমফ্রেমের জন্য সর্বশেষ এবং সবচেয়ে প্রাসঙ্গিক প্যাটার্নগুলো খুঁজে পাবেন।
Bearish pennant
was formed on 31.03 at 16:00:21 (UTC+0)
signal strength 1 of 5

The Bearish pennant pattern has formed on the #AMZN M5 chart. It signals potential continuation of the existing trend. Specifications: the pattern’s bottom has the coordinate of 184.25; the projection of the flagpole height is equal to 866 pips. In case the price breaks out the pattern’s bottom of 184.25, the downtrend is expected to continue for further level 184.10.
The M5 and M15 time frames may have more false entry points.
আরও দেখুন
- All
- All
- Bearish Rectangle
- Bearish Symmetrical Triangle
- Bearish Symmetrical Triangle
- Bullish Rectangle
- Double Top
- Double Top
- Triple Bottom
- Triple Bottom
- Triple Top
- Triple Top
- All
- All
- Buy
- Sale
- All
- 1
- 2
- 3
- 4
- 5
Retângulo de alta
was formed on 09.04 at 02:09:41 (UTC+0)
signal strength 3 of 5
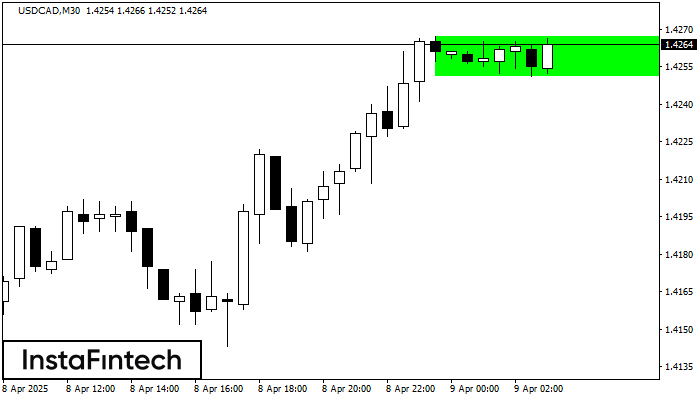
De acordo com o gráfico de M30, USDCAD formou Retângulo de alta. O padrão indica uma continuação da tendência. O limite superior é 1.4267, o limite inferior é 1.4251
Open chart in a new window
Topo duplo
was formed on 09.04 at 02:00:40 (UTC+0)
signal strength 3 of 5
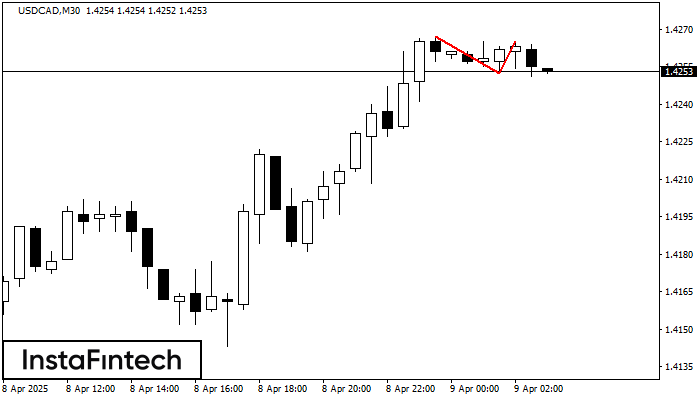
O padrão Topo duplo foi formado em USDCAD M30. Isso sinaliza que a tendência foi alterada de cima para baixo. Provavelmente, se a base do padrão 1.4252 for quebrada
Open chart in a new window
Fundo triplo
was formed on 09.04 at 02:00:14 (UTC+0)
signal strength 2 of 5
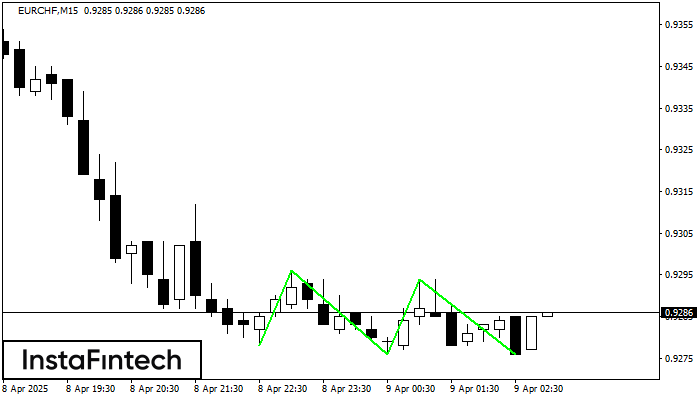
O padrão Fundo triplo foi formado no gráfico do instrumento de negociação EURCHF M15. O padrão sinaliza uma mudança na tendência de baixa para alta no caso de quebra
Os intervalos M5 e M15 podem ter mais pontos de entrada falsos.
Open chart in a new window


