

অ্যাকচুয়াল প্যাটার্নস

প্যাটার্ন হলো গ্রাফিক্যাল মডেল, যা মূল্য ওঠানামার ভিত্তিতে চার্টে তৈরি হয়। টেকনিক্যাল বিশ্লেষণের নীতি অনুযায়ী, ইতিহাসের (প্রাইস মুভমেন্ট) পুনরাবৃত্তি ঘটে। অর্থাৎ, পরিস্থিতি যদি একই রকম থাকে তাহলে প্রাইস মুভমেন্টও প্রায় একই রকম হয়। এর ফলে মূল্যের ওঠানামা কেমন হবে তা আগেই থেকেই অনুমান করা যায়।
ইন্সটাফরেক্স এর প্রাসঙ্গিক প্যাটার্নসমূহ সহজেই ব্যবহার করা যায়, যার মাধ্যমে মার্কেটের সর্বশেষ পরিস্থিতি জানা যায় এবং তার উপর ভিত্তি করে সিদ্ধান্ত নেওয়া যায়। আমাদের সেবাগুলো থেকে আপনি যেকোনো পেয়ার এবং টাইমফ্রেমের জন্য সর্বশেষ এবং সবচেয়ে প্রাসঙ্গিক প্যাটার্নগুলো খুঁজে পাবেন।
Bearish Symmetrical Triangle
was formed on 31.03 at 14:11:15 (UTC+0)
signal strength 1 of 5
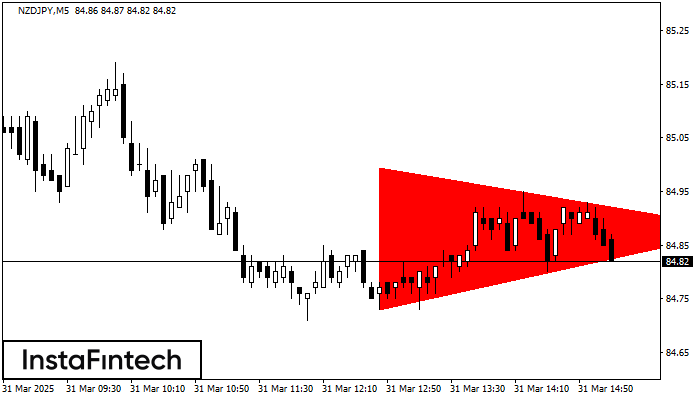
According to the chart of M5, NZDJPY formed the Bearish Symmetrical Triangle pattern. Trading recommendations: A breach of the lower border 84.73 is likely to encourage a continuation of the downward trend.
The M5 and M15 time frames may have more false entry points.
- All
- All
- Bearish Rectangle
- Bearish Symmetrical Triangle
- Bearish Symmetrical Triangle
- Bullish Rectangle
- Double Top
- Double Top
- Triple Bottom
- Triple Bottom
- Triple Top
- Triple Top
- All
- All
- Buy
- Sale
- All
- 1
- 2
- 3
- 4
- 5
Double Bottom
сформирован 21.05 в 07:40:11 (UTC+0)
сила сигнала 1 из 5
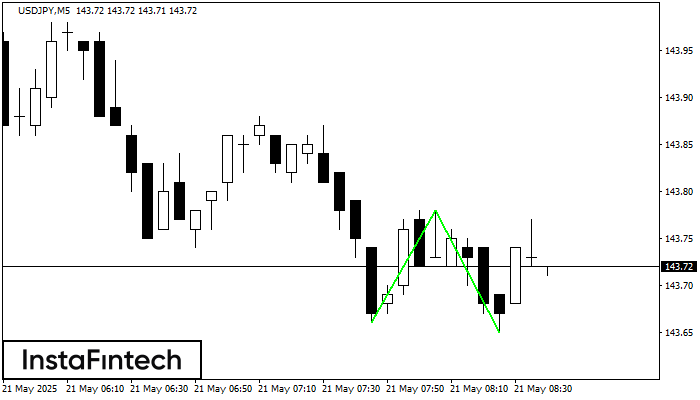
The Double Bottom pattern has been formed on USDJPY M5; the upper boundary is 143.78; the lower boundary is 143.65. The width of the pattern is 12 points. In case
The M5 and M15 time frames may have more false entry points.
Открыть график инструмента в новом окне
Double Bottom
сформирован 21.05 в 06:56:25 (UTC+0)
сила сигнала 1 из 5
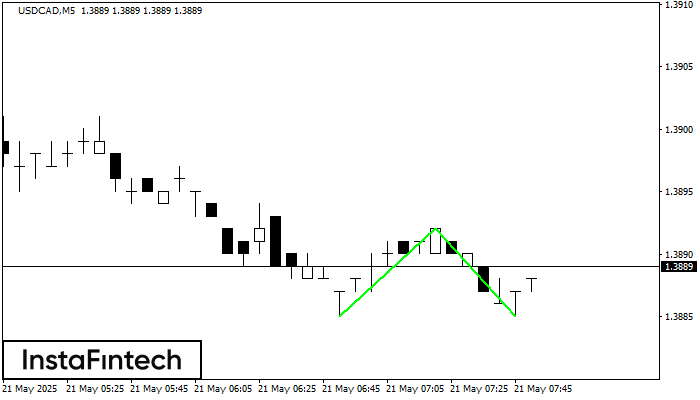
The Double Bottom pattern has been formed on USDCAD M5; the upper boundary is 1.3892; the lower boundary is 1.3885. The width of the pattern is 7 points. In case
The M5 and M15 time frames may have more false entry points.
Открыть график инструмента в новом окне
Double Bottom
сформирован 21.05 в 06:45:15 (UTC+0)
сила сигнала 2 из 5
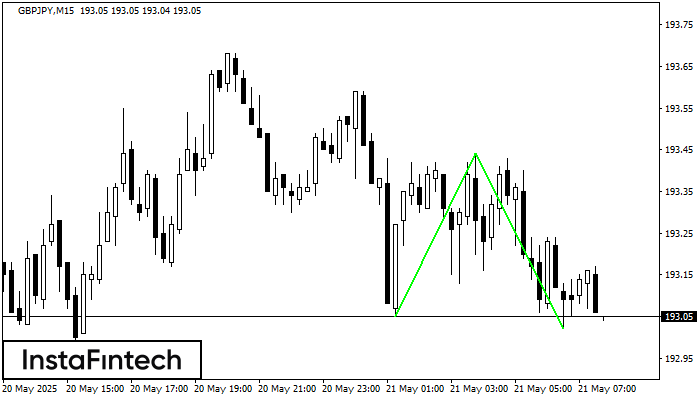
The Double Bottom pattern has been formed on GBPJPY M15; the upper boundary is 193.44; the lower boundary is 193.02. The width of the pattern is 39 points. In case
The M5 and M15 time frames may have more false entry points.
Открыть график инструмента в новом окне


