

النماذج الفعلية

النماذج هي نماذج رسومية تتشكل في الرسم البياني حسب السعر. وفقا لأحد المسلمات التحليلية الفنية، فإن التاريخ (حركة السعر) يكرر نفسه. ويعني ذلك أن حركات الأسعار غالباً ما تكون متشابهة في نفس الأوضاع مما يجعل من الممكن التنبؤ بزيادة تطوير الوضع الذي يتسم باحتمال كبير.
النماذج ذات الصلة المقدمة من قبل إنستافوركس هي خدمة سهلة الاستخدام تسمح لك بمعرفة التغييرات الأخيرة في السوق والرد على الأدلة من السوق في الوقت المناسب. في خدمتنا، ستجد دائمًا النماذج الأكثر حداثة وملاءمة في أي زوج وأي إطار زمني.
Triple Bottom
was formed on 24.04 at 08:30:23 (UTC+0)
signal strength 2 of 5
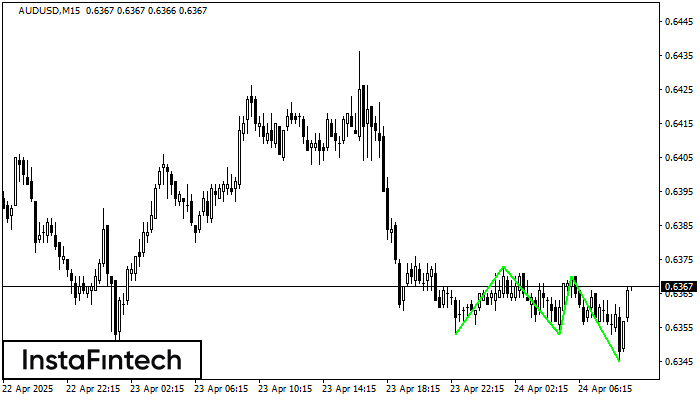
The Triple Bottom pattern has been formed on AUDUSD M15. It has the following characteristics: resistance level 0.6373/0.6370; support level 0.6353/0.6345; the width is 20 points. In the event of a breakdown of the resistance level of 0.6373, the price is likely to continue an upward movement at least to 0.6375.
The M5 and M15 time frames may have more false entry points.
- All
- All
- Bearish Rectangle
- Bearish Symmetrical Triangle
- Bearish Symmetrical Triangle
- Bullish Rectangle
- Double Top
- Double Top
- Triple Bottom
- Triple Bottom
- Triple Top
- Triple Top
- All
- All
- Buy
- Sale
- All
- 1
- 2
- 3
- 4
- 5
Bullish pennant
was formed on 07.05 at 15:02:22 (UTC+0)
signal strength 2 of 5
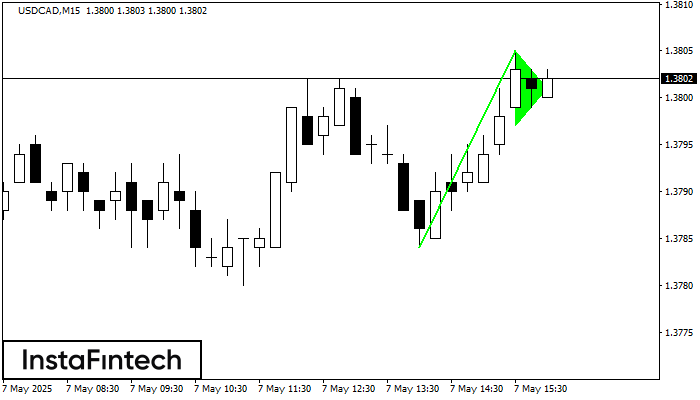
The Bullish pennant pattern is formed on the USDCAD M15 chart. It is a type of the continuation pattern. Supposedly, in case the price is fixed above the pennant’s high
The M5 and M15 time frames may have more false entry points.
Open chart in a new window
Bearish pennant
was formed on 07.05 at 15:00:13 (UTC+0)
signal strength 1 of 5
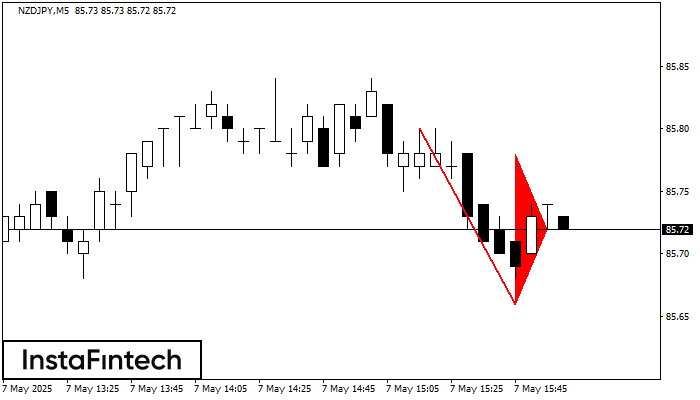
The Bearish pennant pattern has formed on the NZDJPY M5 chart. The pattern signals continuation of the downtrend in case the pennant’s low of 85.66 is broken through. Recommendations: Place
The M5 and M15 time frames may have more false entry points.
Open chart in a new window
Double Top
was formed on 07.05 at 14:44:42 (UTC+0)
signal strength 2 of 5
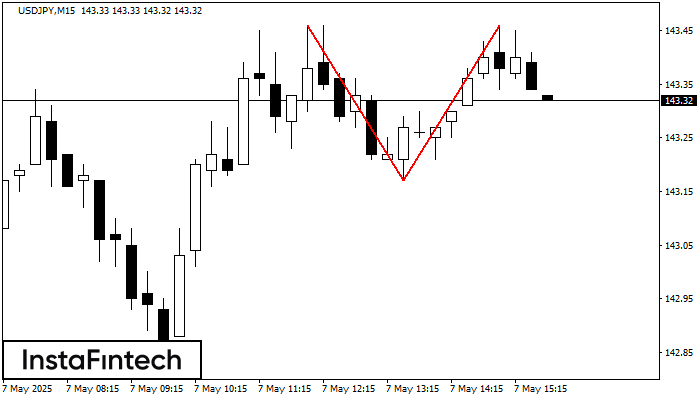
The Double Top reversal pattern has been formed on USDJPY M15. Characteristics: the upper boundary 143.46; the lower boundary 143.17; the width of the pattern is 29 points. Sell trades
The M5 and M15 time frames may have more false entry points.
Open chart in a new window


