

النماذج الفعلية

النماذج هي نماذج رسومية تتشكل في الرسم البياني حسب السعر. وفقا لأحد المسلمات التحليلية الفنية، فإن التاريخ (حركة السعر) يكرر نفسه. ويعني ذلك أن حركات الأسعار غالباً ما تكون متشابهة في نفس الأوضاع مما يجعل من الممكن التنبؤ بزيادة تطوير الوضع الذي يتسم باحتمال كبير.
النماذج ذات الصلة المقدمة من قبل إنستافوركس هي خدمة سهلة الاستخدام تسمح لك بمعرفة التغييرات الأخيرة في السوق والرد على الأدلة من السوق في الوقت المناسب. في خدمتنا، ستجد دائمًا النماذج الأكثر حداثة وملاءمة في أي زوج وأي إطار زمني.
Double Top
was formed on 02.04 at 12:30:07 (UTC+0)
signal strength 3 of 5
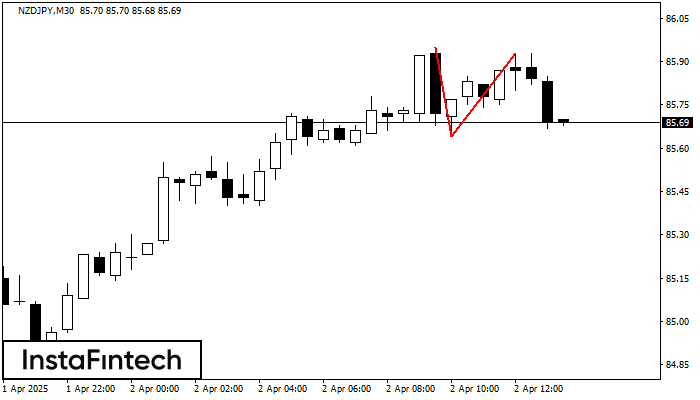
The Double Top reversal pattern has been formed on NZDJPY M30. Characteristics: the upper boundary 85.95; the lower boundary 85.64; the width of the pattern is 29 points. Sell trades are better to be opened below the lower boundary 85.64 with a possible movements towards the 85.34 level.
- All
- All
- Bearish Rectangle
- Bearish Symmetrical Triangle
- Bearish Symmetrical Triangle
- Bullish Rectangle
- Double Top
- Double Top
- Triple Bottom
- Triple Bottom
- Triple Top
- Triple Top
- All
- All
- Buy
- Sale
- All
- 1
- 2
- 3
- 4
- 5
Rectángulo Alcista
was formed on 02.05 at 13:01:57 (UTC+0)
signal strength 1 of 5
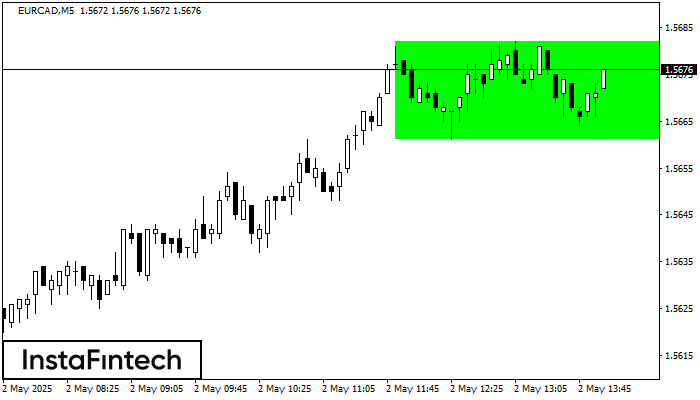
Según el gráfico de M5, EURCAD formó el Rectángulo Alcista que es un patrón de la continuación de una tendencia. El patrón está contenido dentro de los siguientes límites
Los marcos de tiempo M5 y M15 pueden tener más puntos de entrada falsos.
Open chart in a new window
Triángulo Simétrico Bajista
was formed on 02.05 at 12:46:09 (UTC+0)
signal strength 2 of 5
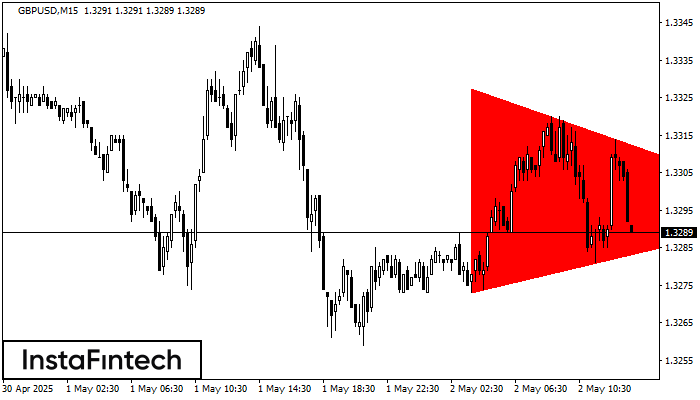
Según el gráfico de M15, el GBPUSD formó el patrón Triángulo Simétrico Bajista. Descripción: El límite inferior es 1.3273/1.3295 y el límite superior es 1.3328/1.3295. El ancho del patrón
Los marcos de tiempo M5 y M15 pueden tener más puntos de entrada falsos.
Open chart in a new window
Doble Techo
was formed on 02.05 at 12:15:24 (UTC+0)
signal strength 1 of 5
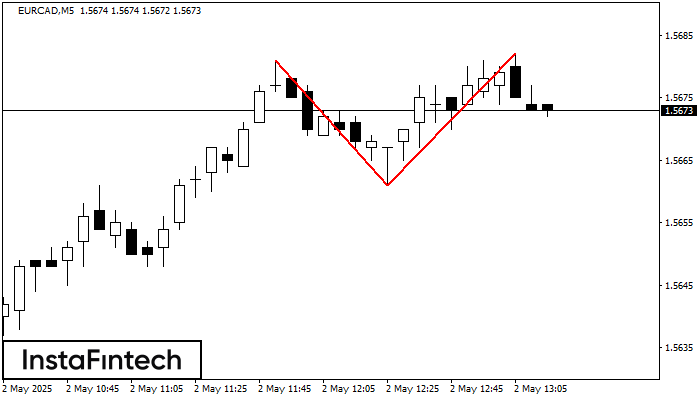
El patrón Doble Techo ha sido formado en EURCAD M5. Esto señala que la tendencia ha sido cambiada de alcista a bajista. Probablemente, si la base del patrón 1.5661
Los marcos de tiempo M5 y M15 pueden tener más puntos de entrada falsos.
Open chart in a new window


