

النماذج الفعلية

النماذج هي نماذج رسومية تتشكل في الرسم البياني حسب السعر. وفقا لأحد المسلمات التحليلية الفنية، فإن التاريخ (حركة السعر) يكرر نفسه. ويعني ذلك أن حركات الأسعار غالباً ما تكون متشابهة في نفس الأوضاع مما يجعل من الممكن التنبؤ بزيادة تطوير الوضع الذي يتسم باحتمال كبير.
النماذج ذات الصلة المقدمة من قبل إنستافوركس هي خدمة سهلة الاستخدام تسمح لك بمعرفة التغييرات الأخيرة في السوق والرد على الأدلة من السوق في الوقت المناسب. في خدمتنا، ستجد دائمًا النماذج الأكثر حداثة وملاءمة في أي زوج وأي إطار زمني.
Double Bottom
was formed on 28.03 at 09:30:15 (UTC+0)
signal strength 2 of 5
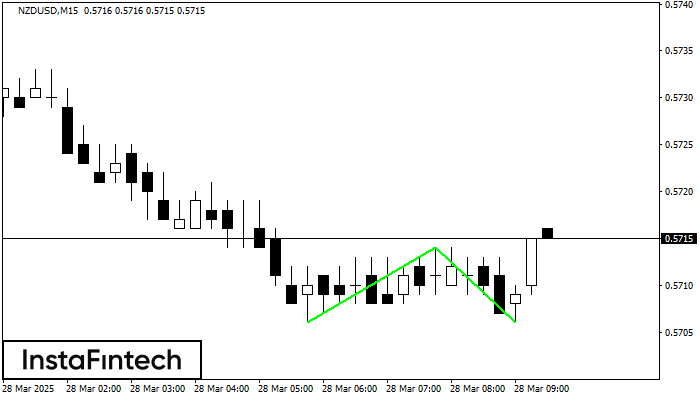
The Double Bottom pattern has been formed on NZDUSD M15. This formation signals a reversal of the trend from downwards to upwards. The signal is that a buy trade should be opened after the upper boundary of the pattern 0.5714 is broken. The further movements will rely on the width of the current pattern 8 points.
The M5 and M15 time frames may have more false entry points.
- All
- All
- Bearish Rectangle
- Bearish Symmetrical Triangle
- Bearish Symmetrical Triangle
- Bullish Rectangle
- Double Top
- Double Top
- Triple Bottom
- Triple Bottom
- Triple Top
- Triple Top
- All
- All
- Buy
- Sale
- All
- 1
- 2
- 3
- 4
- 5
รูปแบบกราฟสี่เหลี่ยมผืนผ้าขาขึ้น (Bullish Rectangle)
was formed on 25.05 at 07:55:30 (UTC+0)
signal strength 1 of 5

อ้างอิงจากชาร์ตของ M5, #Bitcoin ที่ได้สร้างรูปแบบ รูปแบบกราฟสี่เหลี่ยมผืนผ้าขาขึ้น (Bullish Rectangle) ออกมา ซึ่งเป็นรูปแบบของความต่อเนื่องในแนวโน้ม รูปแบบนี้จะอยู่ในขอบเขตตามนี้: ขอบเขตด้านล่าง 107891.05 – 107891.05
ขอบเตระยะเวลาใน M5 และ M15 อาจจะมีตำแหน่งการเข้าใช้งานที่ผิดพลาดมากยิ่งขึ้น
Open chart in a new window
รูปแบบสามเหลี่ยมสมมาตรขาขึ้น (Bullish Symmetrical Triangle)
was formed on 24.05 at 18:46:25 (UTC+0)
signal strength 2 of 5

อ้างอิงจากชาร์ตของ M15, #Bitcoin ที่ได้สร้างรูปแบบ รูปแบบสามเหลี่ยมสมมาตรขาขึ้น (Bullish Symmetrical Triangle) ออกมา ซึ่งแสดงให้เห็นว่า แนวโน้มยังคงเดินหน้าต่อไป คำอธิบาย ขอบเขตด้านบนของรูปแบบนี้สัมผัสพิกัด 109440.14/108872.57 แม้ว่าขอบเขตด้านล่างก้าวผ่าน
ขอบเตระยะเวลาใน M5 และ M15 อาจจะมีตำแหน่งการเข้าใช้งานที่ผิดพลาดมากยิ่งขึ้น
Open chart in a new window
รูปแบบกราฟสี่เหลี่ยมผืนผ้าขาลง (Bearish Rectangle)
was formed on 23.05 at 23:00:20 (UTC+0)
signal strength 1 of 5

อ้างอิงจากชาร์ตของ M5, EURNZD ที่ได้สร้างรูปแบบ รูปแบบกราฟสี่เหลี่ยมผืนผ้าขาลง (Bearish Rectangle) ออกมา รูปแบบนี้แสดงถึง ความต่อเนื่องในแนวโน้ม ขอบเขตด้านบนคือ 1.8982 ส่วนขอบเขตด้านล่างคือ 1.8964 สัญญาณนี้แสดงถึง
ขอบเตระยะเวลาใน M5 และ M15 อาจจะมีตำแหน่งการเข้าใช้งานที่ผิดพลาดมากยิ่งขึ้น
Open chart in a new window


