

النماذج الفعلية

النماذج هي نماذج رسومية تتشكل في الرسم البياني حسب السعر. وفقا لأحد المسلمات التحليلية الفنية، فإن التاريخ (حركة السعر) يكرر نفسه. ويعني ذلك أن حركات الأسعار غالباً ما تكون متشابهة في نفس الأوضاع مما يجعل من الممكن التنبؤ بزيادة تطوير الوضع الذي يتسم باحتمال كبير.
النماذج ذات الصلة المقدمة من قبل إنستافوركس هي خدمة سهلة الاستخدام تسمح لك بمعرفة التغييرات الأخيرة في السوق والرد على الأدلة من السوق في الوقت المناسب. في خدمتنا، ستجد دائمًا النماذج الأكثر حداثة وملاءمة في أي زوج وأي إطار زمني.
Double Bottom
was formed on 26.03 at 04:00:20 (UTC+0)
signal strength 2 of 5
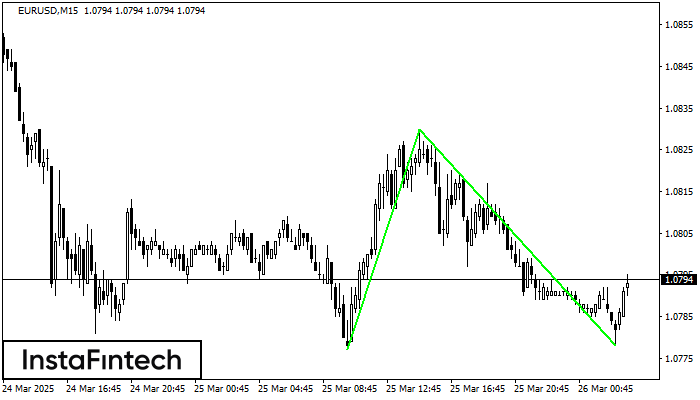
The Double Bottom pattern has been formed on EURUSD M15. This formation signals a reversal of the trend from downwards to upwards. The signal is that a buy trade should be opened after the upper boundary of the pattern 1.0830 is broken. The further movements will rely on the width of the current pattern 53 points.
The M5 and M15 time frames may have more false entry points.
انظر أيضا
- All
- All
- Bearish Rectangle
- Bearish Symmetrical Triangle
- Bearish Symmetrical Triangle
- Bullish Rectangle
- Double Top
- Double Top
- Triple Bottom
- Triple Bottom
- Triple Top
- Triple Top
- All
- All
- Buy
- Sale
- All
- 1
- 2
- 3
- 4
- 5
Topo duplo
was formed on 22.05 at 23:00:29 (UTC+0)
signal strength 4 of 5
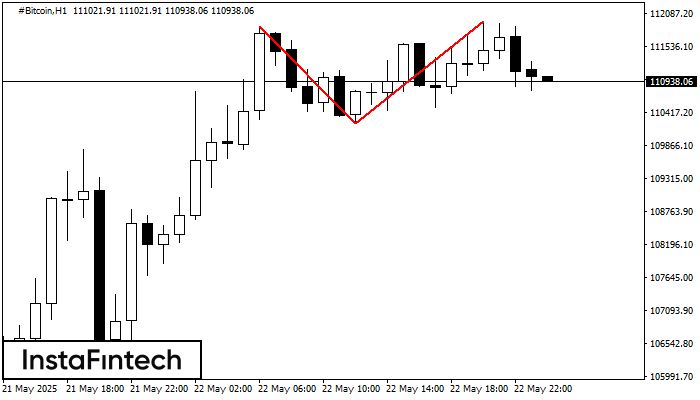
No gráfico de #Bitcoin H1 o padrão de reversão Topo duplo foi formado. Características: o limite superior 111951.72; o limite inferior 110239.46; a largura do padrão 171226 pontos. O sinal
Open chart in a new window
Triângulo Simétrico de Baixa
was formed on 22.05 at 22:01:48 (UTC+0)
signal strength 3 of 5
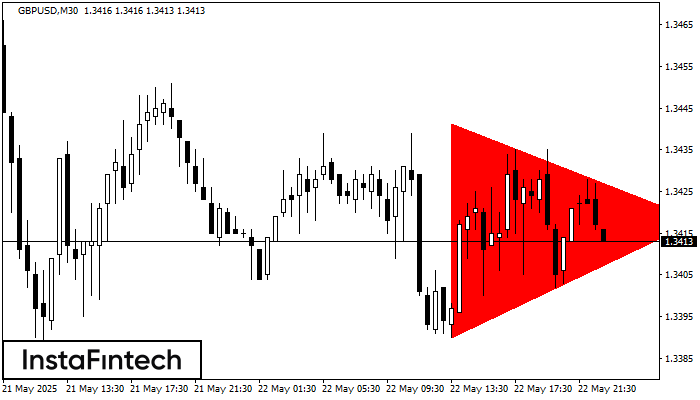
De acordo com o gráfico de M30, GBPUSD fomrou o padrão de Triângulo Simétrico de Baixa. Este padrão sinaliza uma nova tendência de baixa se o limite inferior 1.3390
Open chart in a new window
Triângulo Simétrico de Baixa
was formed on 22.05 at 22:01:15 (UTC+0)
signal strength 2 of 5
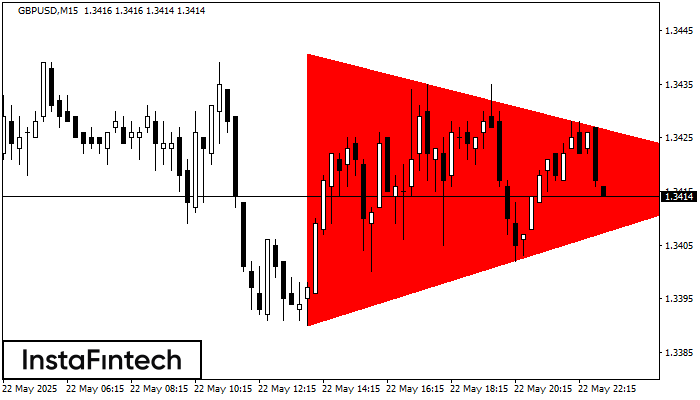
De acordo com o gráfico de M15, GBPUSD fomrou o padrão de Triângulo Simétrico de Baixa. Este padrão sinaliza uma nova tendência de baixa se o limite inferior 1.3390
Os intervalos M5 e M15 podem ter mais pontos de entrada falsos.
Open chart in a new window


