
 08.03.2023 04:27 PM
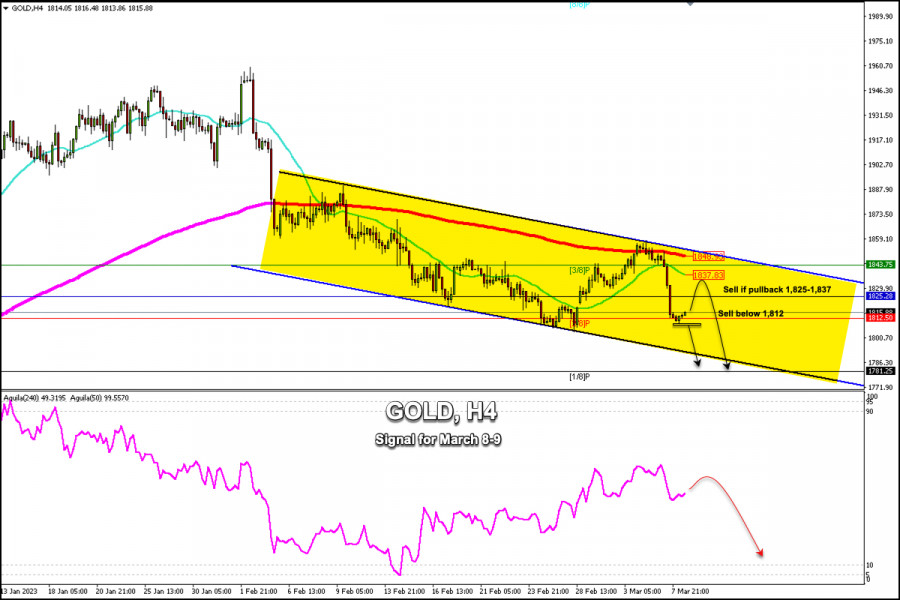
Early in the American session, gold is trading around 1,815.88 below the 21 SMA and below the 200 EMA. Gold is rebounding from a low of 1,809.26 and rising above the 2/8 Murray (1,812). A sustained recovery still seems difficult amid recent statements of more aggressive tightening by the Federal Reserve.
According to the 4-hour chart, we can see that gold is trading within a downtrend channel formed since February 1st. In the next few hours, gold is likely to continue falling and it could reach the bottom of the downtrend channel around 1,786 and even 1/8 Murray located at 1,871.
Powell's statements to Congress will prop up the US dollar and gold will trade under strong volatility. We must be careful and remember that it is time to sell. So, any technical rebound will be seen as a selling opportunity.
The 1,825 -1,837 area could offer strong resistance to gold and the price could resume its bearish cycle. If gold reaches the pivot point of 1,825 in the next few hours and fails to break, this price action could be seen as an opportunity to sell with targets at 1,812 and 1,875.
If gold continues to bounce and reaches the 21 SMA located at 1,837, it could also be an area to sell. In case there is a strong rebound and the metal reaches the 1,843 level (3/8 Murray), it could act as a barrier because it has prevented gold from rallying in a few previous cases.
The technical outlook in the short term remains bearish for gold. Therefore, any technical bounce approaching the 200 EMA located at 1,848 could be seen as a clear signal to sell, thus exerting further bearish pressure.
Our trading plan for the next few hours is to wait for gold to make a technical rebound towards the area of 1,825 (pivot point) or 1,837 (21 SMA) to sell, with the target at 1,781. On the other hand, in case gold breaks and consolidates below 1,812 on the 4-hour chart, it will be viewed as a signal to sell with the target at 1,781 (1/8 Murray).You have already liked this post today
*The market analysis posted here is meant to increase your awareness, but not to give instructions to make a trade.
في السيناريو المعاكس، إذا انخفض اليورو إلى ما دون 1.1490، فمن المحتمل أن يصل إلى المتوسط المتحرك الأسي 200، الذي يقع عند 1.1340 ويتزامن مع قاع قناة الاتجاه الصاعد. سيتم
على الرسم البياني الساعي، ارتد زوج الجنيه الإسترليني/الدولار الأمريكي يوم الخميس من مستوى 1.3520، وارتفع إلى منطقة المقاومة بين 1.3611–1.3620، وارتد منها مرتين، ثم تراجع مرة أخرى إلى مستوى تصحيح
إنستافوركس في الأرقام

Your IP address shows that you are currently located in the USA. If you are a resident of the United States, you are prohibited from using the services of InstaFintech Group including online trading, online transfers, deposit/withdrawal of funds, etc.
If you think you are seeing this message by mistake and your location is not the US, kindly proceed to the website. Otherwise, you must leave the website in order to comply with government restrictions.
Why does your IP address show your location as the USA?
Please confirm whether you are a US resident or not by clicking the relevant button below. If you choose the wrong option, being a US resident, you will not be able to open an account with InstaTrade anyway.
We are sorry for any inconvenience caused by this message.

